The Problem We’ve All Watched Unfold

You know the story. A neighborhood you loved becomes unrecognizable. Long-time residents who raised their families there can no longer afford the rent. Teachers, nurses, artists, the people who actually make a community function, get pushed further and further out. Meanwhile, housing sits empty or gets flipped for profit, and the city council meetings about zoning feel like theater because nobody has the actual tool to stop the displacement.

The traditional market alone isn’t fixing this. Market-rate development happens when it’s profitable, which means it rarely happens in the neighborhoods that need it most. And rental assistance, while crucial, is a perpetual Band-Aid rather than a structural solution. You can rent-stabilize your way into the next fiscal year, but you cannot build stable communities that way.

This is where community land trusts enter the conversation. Not as a sexy solution you’ll see splashed across TechCrunch, but as a quietly effective mechanism that’s actually working at scale in hundreds of American communities right now.

What a Community Land Trust Actually Does (And Why It Works)

A CLT is fundamentally a different ownership model. The trust acquires land—either through purchase or donation—and then holds it permanently on behalf of the community. Individual residents or organizations can own the buildings on that land, but the land itself stays in the trust. When a homeowner sells, the property stays affordable for the next buyer because the affordability is baked into the land itself, not dependent on the market.

This structure solves a real problem that gets overlooked in most housing conversations. Traditional affordable housing often comes with a timeline. A developer builds affordable units with a subsidy, meets their obligation for 30 years, and then the property can convert to market rate. CLTs remove that expiration date. The affordability persists across decades and ownership changes.

The numbers tell this part of the story. During 2024, homeowners in the Champlain Housing Trust in Burlington, Vermont—one of the oldest and most established CLTs in the country—built an average of $14,000 in equity despite the regional market being essentially flat. These were real people accumulating real wealth through homeownership, which is exactly what affordable housing policy should accomplish but rarely does. Compare this to foreclosure rates: CLT homeowners experienced a 0.6% foreclosure rate during the recent interest rate surge from 2022 to 2024, while comparable market-rate homeowners faced a 3.8% foreclosure rate. The difference is systemic. The CLT structure stabilizes ownership.

The Momentum Is Accelerating

The scale has shifted noticeably. Over 300 community land trusts now operate across the United States, a 25% increase since 2020. The largest growth has happened in the South and Midwest, regions you might not immediately associate with housing innovation. This isn’t a coastal phenomenon anymore. It’s happening in cities and rural areas where housing costs have risen faster than incomes, which is almost everywhere at this point.

Federal support has arrived too, though quietly. HUD’s 2025 Community Development report allocated $35 million specifically toward CLT capacity building grants. This is the first dedicated federal CLT funding stream in more than a decade. That money matters because it helps newer trusts build infrastructure, hire staff, and scale operations without immediately having to pull from limited local foundations.

Look at Atlanta’s Westside Future Fund. Launched in 2017, this CLT had preserved over 300 affordable units by 2025 in neighborhoods where median home prices rose 62% during the same period. Think about what that means. The neighborhoods gentrified hard. Prices exploded. And yet 300 families maintained affordable housing in those exact neighborhoods because the CLT structure protected them. This isn’t theoretical impact.

If you want to see what exists near you and get a sense of the movement, the Grounded Solutions Network Community Land Trust Database is comprehensive. You can search by state and city and see what’s actually operating in your region.

Why Your City Probably Doesn’t Have One Yet (And What That Means)

So if CLTs work and the movement is growing, why doesn’t your city have one? Several reasons, mostly unglamorous.

First, CLTs require patient capital and a long time horizon. You cannot get rich quick with a CLT because the model explicitly captures value for homeowners and long-term community stability instead of investors. Second, they require real government support: land donations, zoning flexibility, financing help. Governments that treat housing as purely a market problem don’t naturally gravitate toward CLTs. Third, they need experienced staff and governance. Starting a CLT from scratch is harder than it looks, even with good intentions.

But the research, including analysis from the Lincoln Institute of Land Policy on CLTs, shows the model works at sufficient scale to matter. You’re not betting on an unproven concept. You’re choosing whether to adopt a tool that hundreds of other communities have already validated.

What You Can Actually Do Right Now

If you want to explore this for your community, start with research. Find out if a CLT already exists where you live. If one does, attend a meeting or take a tour of a property they manage. The people who run CLTs are unusually straightforward about how they work and what they’re trying to accomplish. There’s no sales pitch, just explanation.

If one doesn’t exist, contact your city’s planning or community development department and ask whether CLTs have been discussed in recent housing policy conversations. Ask directly. Read the city council minutes. See what’s in the comprehensive plan. Then connect with your local affordable housing coalition or community development corporation—those organizations usually know the landscape and often have opinions about whether a CLT makes sense locally.

This isn’t something you fix by yourself over a weekend. But it’s not hopeless either. CLTs exist because people in hundreds of communities looked at their housing crisis and decided to try a different approach. The tool works. What matters now is whether your community chooses to use it. That choice starts with asking the question.

You Notice It First as a Feeling, Then as Empty Storefronts

There’s a coffee shop on Main Street that used to be where you ran into people. Not friends necessarily, but the kind of familiar strangers who made a place feel alive. The barista knew your order. You’d bump into the retired teacher who volunteered at the library, or the small business owner who always had something interesting to say about the city council meeting from last week. That shop closed in November. A vape store sits empty next to it now. The bookstore across the street held on until February.

You’re not imagining that your town feels lonelier. The data confirms it, and it’s worth understanding why, because the pattern is happening everywhere at the same time, driven by forces your community can actually push back against if you know what you’re looking at.

What We’ve Lost, Measured in Closures and Loneliness

Ray Oldenburg, the urban sociologist who first named the concept of the “third place” back in 1989, published updated research in 2024 that should disturb anyone who cares about how we live together. Only 22 percent of Americans now report visiting a non-home, non-work social space on a weekly basis. In the year 2000, that number was 41 percent. That’s not a gradual decline. That’s a collapse happening in real time, and it’s accelerating.

The U.S. Surgeon General Advisory on Loneliness and Isolation released in 2025 added another layer of context: the number of Americans reporting they have no close friends has quadrupled since 1990. The sharpest increases are in suburban communities, which makes sense when you think about it. Suburbs were designed without third places. They were designed for cars and private yards and isolation, and we’re now living with the consequences of that design choice.

But here’s what gets buried in the national statistics: the specific, local reason your particular coffee shop or bookstore or community center closed wasn’t some vague cultural shift. It was usually economics. Commercial rent increases averaging 18 percent since 2022, according to the National Coffee Association’s 2025 report. Independent coffee shops specifically saw 4,200 net closures nationally in 2024. That’s not because people stopped drinking coffee. It’s because landlords could charge more to chains, or because the building got sold to a developer, or because a small business owner couldn’t absorb another 20 percent jump in monthly overhead.

The Measurement Problem: How Do We Know Which Communities Are Actually Dying?

The Project for Public Spaces, which does real placemaking work in cities across the country, released their 2025 Placemaking Index, and the results should be a wake-up call for anyone in a mid-sized community. Out of the hundreds of American cities evaluated, only 11 scored high enough to be classified as having “healthy third place ecosystems.” Most mid-sized cities scored below 40 out of 100. Most. That’s not failure in a few places. That’s systemic failure across the entire country.

What matters about this data, though, is that the index is measurable, which means it’s fixable. Project for Public Spaces Placemaking Resources breaks down exactly what they’re looking for. Are there multiple venues where people can gather? Are they accessible by walking or transit? Are they safe? Do they serve people across different age groups and income levels? Can you actually sit and talk, or is the environment designed to move people through quickly?

When you look at your own town through this lens, you stop seeing the problem as inevitable cultural decline and start seeing specific, addressable planning failures. The coffee shop closed because of rent. The park has no seating. The community center hours don’t match when working people can actually get there. These are solvable problems, but you have to name them first.

What Actually Works: Two Cities That Decided to Do Something

In 2025, Tempe, Arizona and Raleigh, North Carolina both launched what they called “Third Place Activation Grants.” The amounts were modest: $5,000 to $25,000 per venue. The goal was straightforward: help small community venues offset rent increases so they could stay open. The results were specific enough to be useful. Twelve months later, 87 percent of the Tempe grant recipients were still operating.

This matters because it proves the problem is solvable with actual resources and actual planning, but also because it shows what the work looks like on the ground. Both cities had to do research first. They had to identify which venues were actually functioning as third places. They had to understand the landlord economics. They had to figure out what the difference between a $5,000 grant and a $25,000 grant actually meant in practice for a small business. They didn’t just throw money at the problem. They thought about it structurally.

And then they had to go to city council and argue for it. They had to explain to skeptical people why a coffee shop mattered enough to spend municipal funds on it. They had to make the case that loneliness is not a personal failing but a design problem, and that fixing design problems is something government can actually do.

What Your Community Can Do Right Now

You probably don’t have the authority to create city grants, but you can do the research that makes those grants possible later. Start by walking around your town with the Placemaking Index in mind. Where can people actually sit and talk for free or cheap? Are those places accessible to people without cars? Are they welcoming to people of different ages? Write down what you find. Talk to the owners of the places that are still working. Ask them what their rent is, when they pay it, and what would actually keep them alive.

Connect with other people who care about this. It’s not work you do alone, which is kind of the whole point. Take those observations to your city council member. Show them the data. Ask them what Tempe and Raleigh are doing that your city isn’t. Propose a listening session where business owners can talk about what they need. Put the question directly: do we want to be a place where people gather, or are we okay with being a place where everyone stays home?

The coffee shop closing wasn’t fate. Your town feeling broken isn’t inevitable. It’s the result of specific choices about what we fund, what we value, and what we’re willing to pay attention to. Those choices can change, but it starts with looking at the data, understanding what it means, and deciding to do something about it. The work is real. It’s also doable. What are you waiting for?

What Oxford’s Traffic Filters Actually Changed

If you’ve been following the Oxford pilot program that launched in 2022, you’ve probably heard the term “traffic filter” thrown around at neighborhood meetings. Here’s what actually happened: the city installed barriers that prevent through-traffic in certain residential zones during specific hours. For three years, Oxfordshire County Council Traffic Data tracked the results. The findings show a 14 percent reduction in car journeys through filtered neighborhoods. That’s not earth-shattering, but it’s real, and it matters more than you might think.

A 14 percent reduction doesn’t mean cars vanished from the streets. It means some people changed their behavior. Some found alternate routes. Some combined trips. Some shifted to other transportation methods. The traffic didn’t disappear — it was redistributed. This is exactly where the conversation gets complicated, and also exactly where your neighborhood probably sits right now. The question isn’t whether 15-minute city principles work. The question is whether the tradeoffs are worth it to the people actually living there.

The Reality Beyond the Headlines

Researchers at MIT’s Senseable City Lab studied ten European cities that implemented 15-minute city design principles and found that residents reduced their daily car travel by an average of 22 minutes per day when the infrastructure was fully built out. That’s substantial. But here’s the word that matters: fully. It took years, not months. It required reliable public transit, usable bike lanes, grocery stores within actual walking distance, and medical clinics you could reach without a car. Most cities don’t have that. Most neighborhoods don’t either.

The gap between theory and practice is where your life actually happens. A city can draw beautiful maps showing how everything connects in fifteen minutes. But if the bus runs every thirty minutes and the grocery store closes at 6 p.m., the math doesn’t work for someone working a retail shift. If the only bike route requires crossing four lanes of traffic, families won’t use it. This is why looking at real pilot data matters. It shows you what actually changed, which tells you what needs to happen next.

What Other Cities Are Learning (And the Money It Takes)

Portland, Oregon took a different approach entirely. In 2025, they allocated forty-eight million dollars across twelve underserved neighborhoods, specifically targeting the areas that failed their walkability audits. Instead of implementing traffic restrictions first, they started by identifying where people couldn’t reach essential services without a car. They funded new grocery access, transit improvements, and street redesigns. The 87 member cities in the C40 Cities 15-Minute City Framework collectively represent over 700 million residents, and most of them discovered the same thing: you can’t restrict car access to neighborhoods that lack alternatives.

Portland’s investment reveals the actual cost of making this work. Forty-eight million dollars for twelve neighborhoods. Do the math for your city. The reason many 15-minute city conversations stall isn’t ideology. It’s logistics and funding. You can restrict traffic tomorrow with bollards and signs. You can’t install reliable transit or new businesses in weeks or months. This matters for your commute because it determines whether this stays a debate or becomes real change.

The Neighborhood Support Numbers (And What They Don’t Tell You)

A Pew Research Center survey from late 2024 found that 61 percent of Americans say they support walkable neighborhood design. That sounds solid. But the same survey showed that 44 percent oppose any restrictions on car access to achieve it. These aren’t completely different groups either. Many people support the goal but reject the method. They want walkability without inconvenience. They want less traffic on residential streets but full car access. They want neighbors using transit without losing their own parking. This contradiction lives in most neighborhoods.

Understanding this helps you understand your neighborhood’s actual position. You likely aren’t in disagreement about whether walkability matters. You’re probably working through what happens to the person who needs to drive, who can’t afford a bike, or whose job doesn’t align with transit schedules. These are real constraints. Acknowledging them doesn’t mean abandoning the goal. It means designing solutions that don’t assume everyone looks the same or lives the same life.

What You Actually Need to Know About Your Own Streets

Before anything changes in your neighborhood, you need a clear picture of what’s already working and what isn’t. Walk or bike your current routes. Where do they go? Do they connect to schools, medical offices, grocery stores, or libraries? How long do these trips actually take? Time them. Talk to your elderly neighbors, to people who don’t drive, to families without cars. Ask delivery drivers and service workers what routes they use. This data is more valuable than any city council report because it’s specific to your actual neighborhood.

Then look at the transit question honestly. How often does the nearest bus run? How reliable is it? Does it go where people actually need to go? If a 15-minute city framework is going to work where you live, public transportation has to improve first. Traffic restrictions can follow, but they’re not the starting point. The starting point is making alternatives real and reliable. That might mean advocating for better bus service or a new pedestrian path. It might mean working with neighbors to create a community bike repair station. It might mean pushing the city to open fresh food access in your area. These are the conversations that matter most.

The Oxford data is useful, but it’s Oxford’s data, not yours. Portland’s forty-eight million dollar investment is happening in Portland. Your commute, your neighborhood, your life exists in a specific place with specific constraints and specific opportunities. Read the city council minutes. Ask questions about what’s actually planned for your area. Talk to neighbors at coffee shops and on your street. Then decide what you’re willing to support and what you want to change. That’s where real community engagement lives.

The Money Is Real, The Clock Is Ticking, And Your Community Might Miss It

There is forty-two billion dollars sitting on the table right now. That is not hyperbole or a political talking point. The Broadband Equity, Access, and Deployment Program, administered by the National Telecommunications and Information Administration, represents the largest federal investment in broadband infrastructure in American history. If your town does not have gigabit internet, or if your community is one of the roughly fourteen and a half million American locations still lacking basic broadband access, this money was theoretically designed with you in mind.

The $42 Billion Broadband Rush: Why Your Town Needs to Act Now (And Why It's Complicated)
The $42 Billion Broadband Rush: Why Your Town Needs to Act Now (And Why It’s Complicated)

But here is the thing about government money: it does not distribute itself. It sits in accounts and programs and state implementation plans, waiting for communities to apply, to advocate, to show up in the right rooms at the right time. Some towns have already figured this out. Louisiana and Virginia moved quickly through their BEAD planning processes and positioned themselves to begin actual construction contracts in late 2025. Meanwhile, other communities are still asking their city council members what BEAD even stands for.

The real deadline anxiety does not stem from money running out tomorrow. It comes from state implementation plans. By early 2026, approximately thirty-eight states had received approval for their BEAD plans from the federal government. That approval matters enormously, because it unlocks the actual distribution of funds to local providers and municipalities. If your state has not yet finished its plan, or if your community has not made itself visible within that plan, you are already playing catch-up.

Understanding the Gap: Who Is Actually Without Broadband, and Why It Matters

The FCC updated its broadband mapping data in June 2025, and the picture remains stubbornly uneven. Fourteen and a half million locations across the United States still lack access to twenty-five megabits per second download and three megabits per second upload speeds. That is the federal minimum definition of broadband. These locations are not scattered randomly. They cluster in rural areas, on tribal lands, and in regions where the economics of infrastructure investment have never made private companies particularly interested.

This is where disagreement begins, even among people who want to solve the problem. Some rural advocates argue that the BEAD Program’s funding levels, while historic, still underestimate what it actually costs to build fiber networks across sparsely populated terrain. A provider serving five hundred people across fifty square miles faces entirely different economics than one serving five thousand people in the same space. Rural stakeholders push back against funding formulas they see as biased toward denser areas. Urban and suburban leaders, meanwhile, point to their own infrastructure challenges and argue that broadband equity cannot mean urban communities get nothing.

The structural tension is real. Every dollar allocated to one community is not available for another. The BEAD Program attempted to address this by prioritizing unserved areas, but that prioritization itself becomes a point of contention. Some rural towns feel they have waited long enough. Some suburban communities wonder why their aging infrastructure does not count as urgent.

What everyone agrees on is this: the gaps exist. An estimated three billion dollars in economic activity over the next decade hinges on closing them. Research from 2025 by the Benton Institute for Broadband and Society found that every dollar invested in rural broadband infrastructure generates approximately three dollars and twenty cents in regional economic activity over a ten-year period. That is not abstract benefit. That is jobs, business development, agricultural innovation, and education access.

The Fabric Challenge Process: Your Community Has a Voice in the Data

Before any broadband money reaches your town, the government needs to know where the gaps actually are. This is where the process gets both more democratic and more complicated than it sounds. The FCC’s broadband coverage maps, which determine which areas qualify for BEAD funding, are based on data submitted by internet service providers themselves. If those maps are wrong, your community might miss eligibility for funding it desperately needs.

The NTIA created a formal process called fabric challenges. If you believe the coverage maps inaccurately show broadband availability in your area, you can submit evidence and challenge the map. During the 2024 mapping cycle, communities across the country submitted challenges that corrected over two million eight hundred thousand location errors. That number is staggering. It means the maps, as initially filed, were substantially wrong in millions of places.

This is where civic engagement becomes technical work. Community groups have partnered with broadband advocacy organizations to conduct actual speed tests, document dead zones, and prove that the maps lie about their neighborhoods. It is unglamorous work. It involves spreadsheets and wifi testing apps and carefully documented coordinates. But it works. Your town might already have inaccurate broadband data filed with the FCC. The fabric challenge process gives you a mechanism to correct it before funding deadlines close.

The disagreement here is between different kinds of expertise. The FCC relies on provider data because providers have comprehensive records. But providers also have incentives to overstate coverage in some cases and understate it in others. Community-based data is messier, less comprehensive, but often more accurate on the ground. Getting both to align requires communities to participate actively, test their own networks, and push back when the official maps do not match their lived experience.

State Plans, Local Strategy: What Your Town Actually Needs to Do

The flowchart looks roughly like this. Your state submitted a BEAD implementation plan to the NTIA. That plan outlined how the state intends to allocate funding, which areas get priority, what the application process looks like for providers wanting to build infrastructure. Some states are treating this as primarily a state-level program, allocating funds through competitive processes. Others are devolving decision-making to local governments or regional entities. This variation matters enormously for how your community participates.

If your state has already received BEAD plan approval, the next step depends on your state’s specific approach. Check your state’s broadband office, usually housed in economic development or telecommunications agencies. That office should have published guidance on how local communities and private providers can apply for funding. If your state is still developing its plan, your window for community input might still be open. Attend town halls. Submit comments. Make it clear that your community has unmet broadband needs and is ready to partner on solutions.

Local governments can also challenge the accuracy of coverage maps before state plans are finalized. This is one of the most direct levers communities have. If your town can demonstrate that the FCC coverage map incorrectly shows your area as served, you increase the likelihood that state planners will prioritize your community for BEAD funding. Check the FCC Broadband Data Collection Map for your specific address. Document any inaccuracies. File a challenge through the formal process.

For broader guidance on where your state stands in the BEAD process, the NTIA BEAD Program State Tracker maintains current information on state plan approval status and implementation timelines. That is the authoritative source for where your state lands in the process.

The Disagreement Nobody Is Quite Naming Yet

Here is the structural conflict hiding beneath the surface of most BEAD discussions, and it is worth naming plainly. The question is not whether broadband equity matters. The question is whether the BEAD Program, as currently structured and funded, is sufficient to solve the problem fairly across all geographies and community types.

Rural broadband advocates argue that current funding levels still leave massive infrastructure gaps. Fiber to the last mile in genuinely remote areas remains expensive, and BEAD funding might cover eighty percent of actual costs, leaving communities or providers to find the remaining twenty percent. Some communities lack the local resources to fill that gap. In those cases, broadband equity means nothing.

Meanwhile, suburban and some urban communities argue that aging infrastructure, increasing demand, and fiber network expansion in their areas also constitute broadband equity issues. A community where broadband exists but is expensive, slow, or provided by a single monopoly provider faces real constraints too. The disagreement reflects genuine resource limitations and legitimate competing priorities, not just political posturing.

The most productive response is not to pretend the disagreement does not exist. It is to ensure that your community has the best possible data, makes its case clearly, and participates actively in the process. The money is real. The deadline is real. But so is the competition for it.

What Happened to Our Library This Year

I sat in the district office last month with three printed policy documents spread across a laminate table, a coffee getting cold beside them. The board had voted in March on what they called “curriculum alignment standards,” and I wanted to know exactly what that meant. Not what anyone said it meant at the heated public comment period. Not what the Facebook arguments had spiraled into. What the actual documents said.

The School Board Curriculum Fights of 2025 Came for Our District — Here's What the Actual Policy Documents Say
The School Board Curriculum Fights of 2025 Came for Our District — Here’s What the Actual Policy Documents Say

Three titles were removed from our middle school library that week. Two more from the high school. The district called it “resource optimization.” I called the librarian, who called it something else entirely, though she was careful to say it only after checking that the door was closed.

This isn’t about whether those specific books should have stayed or gone. This is about what we stopped having access to when we let those conversations happen in the abstract. This is about the concrete loss of something specific we had built, slowly, over years.

Illustration for The School Board Curriculum Fights of 2025 Came for Our District — Here's What the Actual Policy Documents Say
Illustration for The School Board Curriculum Fights of 2025 Came for Our District — Here’s What the Actual Policy Documents Say

The Numbers Tell a Story That Feels Abstract Until It Doesn’t

The PEN America Education Censorship Index documented nearly 10,000 instances of book challenges across 36 states during the 2023-2024 school year alone. That’s a 28 percent jump from the year before. We’re not at a plateau. The momentum kept building straight into the 2025-2026 school year. This isn’t a local thing. This is what’s happening to libraries and classrooms in nearly every state, including ours.

What made this real for me wasn’t the statistic. It was learning that our district’s removal decisions happened without our librarian having a structured appeal process documented anywhere. She could object, she was told, but there was no written procedure for how that objection would be evaluated. That matters more than you’d think. A procedure is democratic. An absence of procedure is just whatever happens.

Across the country, 47 state legislatures have introduced or passed some form of legislation about curriculum transparency or parental rights in education since 2021. The word “transparency” appeared in almost every board meeting agenda I attended this year. Everyone wanted to be transparent. Nobody seemed to want to define what that word actually obligated them to do.

The Documents Say One Thing, But the Infrastructure Says Another

I asked for our district’s full curriculum documents. The ones that would tell me what exactly was being taught, what books were assigned, what the frameworks actually were. The administrator I asked looked confused, then sympathetic, then explained they weren’t really formatted for public access. They existed, she said. They were just sort of scattered across different platforms and building-level drives. She could get me some of it eventually, if I submitted a formal request.

Here’s what a curriculum quality review by the Thomas B. Fordham Institute found in 2025: fewer than 30 percent of school districts in this country have their curriculum documents posted anywhere that a parent could actually find them within a single click from the district homepage. We talk constantly about transparency and parent involvement and educational choice, but most families don’t have access to the actual documents that would let them make informed decisions. It’s not that the information is secret. It’s that it’s inaccessible, which does the same work.

Our district falls into that 70 percent. We have excellent parent volunteers. We have teachers who care deeply. But there’s no system where a parent sitting at home could actually pull up our curriculum in a format they could read and search and share. That’s not about good intentions. That’s about infrastructure, which is unsexy and easy to defer.

What We Actually Lost When the Removals Started

The research from RAND Corporation K-12 Education Research on districts that removed curriculum related to diversity and inclusion found something interesting: standardized test scores didn’t improve. Not even a little. But teacher retention dropped by 11 percent on average. The teachers who had designed lessons, integrated materials, built relationships around diverse perspectives were more likely to leave.

Our two most experienced English teachers left over the summer. Both of them had been here twelve years. When I asked why, they were tactful, but the timing was clear. They had built units around books that were no longer on the approved list. They had collaborated with colleagues on projects that suddenly didn’t fit the parameters. They looked ahead and saw a narrower curriculum, and they decided to look for work elsewhere.

Last month, I learned that teachers across the country are now spending an average of 612 dollars of their own money annually to replace or supplement materials removed from approved curriculum lists. That’s not a metaphor. That’s teachers buying books themselves because they believe their students need them. That’s an indictment of something. I’m not entirely sure what yet, but it’s real and it’s quantified and it matters.

What Happens When You Actually Read the Fine Print

The policy documents in front of me on that table had been written carefully. They used phrases like “age-appropriate alignment” and “community values reflection” and “educational best practices.” Nowhere did it say “we are going to make decisions about what students can read.” It just happened as a logical consequence of the language. That’s not an accident. That’s how this works.

When you read the actual minutes, the decisions were never presented as removals. They were presented as “reallocation of resources” or “curriculum refinement” or “parental feedback integration.” Only when you cross-reference three different meetings and four different documents do you realize what the cumulative effect was. A student who graduated two years ago had different access to literature than a student entering high school now. That’s the difference between what was written and what actually happened.

The point of telling you this is not to convince you that I’m right about what should or shouldn’t be in schools. The point is that these decisions happened in a way that made it hard to actually see them happening. They’re embedded in policy language that sounds neutral. They appear as consequences of something else. You have to actually read the documents. You have to cross-check them. You have to ask follow-up questions to people who would rather you didn’t.

That’s the real thing we need to talk about. Not whether books should be removed or kept. Whether the processes for making those decisions are transparent enough that ordinary people can participate in them. Whether teachers have clarity about what they can teach. Whether families actually understand what their kids are learning. Whether there’s an actual procedure for someone who thinks a decision was wrong.

I’m still working through these documents. The coffee’s long cold, but the table’s still full of papers. If you want to look at your own district’s curriculum documents, I’d be happy to compare notes over coffee on a Saturday. Better yet, I’d like to help figure out how we actually make these things accessible. That part seems like work worth doing together.

What We’re Actually Arguing About

If you’ve been to a city council meeting in the past year, you’ve probably heard someone mention the 15-minute city. Maybe they said it with hope. Maybe they said it like a warning. The concept sounds simple enough: neighborhoods redesigned so that most daily needs are within a 15-minute walk or bike ride. Groceries, schools, healthcare, work, community space. All close. All accessible without a car.

The 15-Minute City Debate Is Tearing Local Communities Apart — Here's What the Research Actually Shows
The 15-Minute City Debate Is Tearing Local Communities Apart — Here’s What the Research Actually Shows

But somewhere between that simple idea and what’s happening in real neighborhoods, we’ve lost the thread. The 15-minute city has become a proxy war. Urban planners and sustainability advocates talk about walkability and local economies. Residents in other communities are organizing against what they see as top-down urban redesign. Caught in the middle are the actual people living in these neighborhoods, trying to figure out what’s real and what’s rhetorical.

Here’s what’s making this debate so bitter: it’s not really about a concept anymore. It’s about trust. It’s about whether your city government is listening to you or designing your life without you. It’s about whether change is happening to you or with you.

Illustration for The 15-Minute City Debate Is Tearing Local Communities Apart — Here's What the Research Actually Shows
Illustration for The 15-Minute City Debate Is Tearing Local Communities Apart — Here’s What the Research Actually Shows

The Numbers Tell a Quieter Story Than the Shouting

Let’s start with what’s actually happening on the ground. At least 12 U.S. cities including Detroit, Austin, and Denver have formally adopted or are piloting 15-minute city zoning frameworks, following the well-documented model that Paris implemented. These aren’t hypothetical anymore. They’re real zoning changes affecting real neighborhoods right now.

When researchers from MIT’s Urban Mobility Lab studied neighborhoods that were redesigned under these principles, they found something interesting: residents reported taking 22% fewer car trips per week. That’s not a small change. That’s the difference between commuting alone and walking to get a coffee. But here’s the part that matters more for your community: local business revenue increased by 19%. More foot traffic. More neighbors seeing neighbors. More small business survival.

Portland, Oregon has been at this longer than most cities. Their 20-Minute Neighborhood initiative, detailed in their Portland Bureau of Planning 20-Minute Neighborhood Initiative, reduced average resident commute times by 8 minutes per day. Eight minutes doesn’t sound radical until you do the math: that’s over 60 hours per year that people aren’t sitting in traffic. That’s time with their families. That’s time volunteering. That’s time for life to actually happen.

The Congress for the New Urbanism 2025 Annual Report shows that mixed-use zoning applications increased by 28% nationally compared to just two years ago. Developers are betting money on this model. Cities are rewriting their rule books. This is happening.

Why So Many People Believe It’s a Conspiracy

A YouGov poll from October 2025 found that 41% of Americans had heard of the 15-minute city concept. That’s actually remarkable penetration for an urban planning term. What’s less remarkable, and more troubling, is that 38% of those people associated it primarily with conspiracy theories rather than actual urban planning policy.

Stop and think about that for a moment. More people think 15-minute cities are a plot than think they’re a planning tool. That’s not a failure of the concept. That’s a failure of communication. A failure of trust.

The conspiracy theories aren’t random. They tap into something real: the experience of having neighborhood change imposed on you. When zoning happens without community input, when small businesses get displaced by development, when rents rise faster than wages, when the corner store your grandmother used suddenly turns into luxury condos, that’s not a conspiracy. That’s what actually happened. The theories attach themselves to 15-minute cities because the emotional truth is there, even if the factual basis isn’t.

This is what we’ve lost: the confidence that our neighborhoods are ours. That we have a voice in what happens here. That change isn’t something done to us.

The Real Question Isn’t About Walkability

Here’s what the research can’t show you: whether your city actually listened to you before deciding your neighborhood was getting redesigned. Numbers don’t capture the feeling of walking into a council meeting and realizing the plan has already been decided. Data doesn’t explain why a barber who’s been on your block for 15 years suddenly can’t afford the rent because the building was sold to developers banking on the neighborhood’s new walkability index.

The best 15-minute city implementations have one thing in common: they involved their neighborhoods early and often. They asked people what they actually needed within walking distance. They created protections for existing small businesses. They had conversations, not announcements. In places where this happened, the opposition softened. People understood that change was coming anyway, but at least they had a role in shaping it.

The worst implementations did what cities have always done: decided what was best and expected people to accept it. Then they were shocked when people started showing up to council meetings angry.

What Happens Now, and What You Can Actually Do

If you care about your neighborhood, the path forward is boring and specific and completely within your reach. Go to the next city planning meeting. Read the zoning documents. Find out if your city is considering any kind of mixed-use zoning changes. Ask questions. Not angry questions. Specific ones. What protections exist for current residents? Who decided this was a priority? How will small business owners be supported through any transition?

The data suggests that 15-minute city principles work better than car-dependent sprawl. It’s not a conspiracy. It’s not magic. It’s just that when things you need are close, life is less exhausting and communities are stronger. But that’s only true if the people living there chose it, or at least had a genuine voice in shaping it.

The debate tearing communities apart right now is really a debate about power. Who decides what your neighborhood becomes? You can let that decision happen in a room without you, or you can show up. One takes no time. The other takes coffee and stubbornness and actually reading the agenda. The research is clear about what works. The question is whether we’ll get there with people, or do it to people. That part is entirely up to us.

The Budget Moment We’re Actually In Right Now

Your city council just finished or is finishing voting on next year’s budget. Thousands of lines of text have been debated, revised, combined, and approved in public meetings that roughly seven out of every hundred residents in your town probably attended. The other ninety-three of you are about to live under spending decisions you didn’t know were being made. This isn’t a criticism. It’s a structural reality. But it’s also a fixable one, and right now in early 2025 is the exact moment to understand what actually happened and what it means for where you live.

What Your City Council's 2025 Budget Actually Says About Your Neighborhood (Breaking Down the Line Items Nobody Reads)
What Your City Council’s 2025 Budget Actually Says About Your Neighborhood (Breaking Down the Line Items Nobody Reads)

Here’s what makes this particular budget season different from most: your city is almost certainly dealing with a specific pot of federal money that’s running out. The infrastructure funding that passed Congress back in 2021 is making its final major disbursement to local governments right now. That’s roughly 550 billion dollars that cities have been gradually receiving over the past few years, and the last tranche is hitting local accounts in 2025. Your council members have been in a room somewhere deciding how to spend it. Those decisions explain a lot of what you’re about to see happening on your streets.

Illustration for What Your City Council's 2025 Budget Actually Says About Your Neighborhood (Breaking Down the Line Items Nobody Reads)
Illustration for What Your City Council’s 2025 Budget Actually Says About Your Neighborhood (Breaking Down the Line Items Nobody Reads)

Follow the Infrastructure Money First

Most cities across the country are doing something similar right now: they’re increasing what they spend on infrastructure. According to the National League of Cities 2025 State of the Cities Report, roughly two-thirds of municipalities increased infrastructure spending compared to their 2024 budgets. The average bump was twelve percent. That’s a lot. But infrastructure is a broad category. It can mean repaving streets, replacing water mains, fixing bridges, upgrading internet access, or hardening power systems against storms. The real question is which category your city chose.

Pull up your city’s actual budget document. Yes, the long PDF. Search for capital projects or infrastructure line items. You’ll see either specific projects listed or broader categories like “street maintenance” or “water systems.” This is where the federal money is going. Some cities are betting on fixing things that are already broken. Others are betting on prevention. Some are focused on visible infrastructure like roads. Others are making less obvious choices like upgrading stormwater systems or replacing lead pipes in older neighborhoods. None of these choices are wrong, exactly. They’re just different bets about what matters most.

The Public Safety Conversation That’s Actually Happening

In forty-three of the fifty largest cities in the country, public safety budgets went up by at least five percent this year. That’s not a secret. It’s in every municipal budget that got voted on. But the conversation around that increase is fractured in ways that budget documents don’t really capture. Some neighborhoods wanted more police presence and faster response times. Other neighborhoods wanted different kinds of support: mental health crisis workers, housing programs, community coordinators. Both groups asked their city council to allocate more money. Councils in many cities tried to do both. Sometimes that meant the total safety budget increased even as police department allocations held steady or slightly decreased, because money went to alternative response programs too. Sometimes it meant police funding increased outright.

The thing about budget numbers is that they can be accurate and misleading at the same time. A five percent increase in public safety spending sounds concrete, but it tells you almost nothing about whether that money is going toward more patrol cars, body cameras, community programs, mental health support, or hiring freezes in other departments to fund overtime. You have to read deeper. Look at what specific programs got added or expanded. Look at what got cut to make room. The budget is the actual conversation your city had, but you have to learn to read it like a language.

What Most People Miss: The Things That Didn’t Get Funded

City budgets are defined as much by what’s missing as by what’s in them. A neighborhood that wanted a new community center but got street lighting upgrades instead is technically getting investment. Technically accurate, not entirely satisfying. Parks departments routinely ask for more than they get. Mental health services request expansions that get partially funded. Housing programs hope for resources that materialize at half the requested amount. These aren’t failures. They’re just the reality of finite resources and competing priorities.

This is where conflict actually lives in municipal budgeting, and it’s worth understanding clearly. It’s rarely a battle between good and evil. It’s usually a disagreement between legitimate needs. A neighborhood association wants more tree planting in their area. The parks department wants to maintain existing trees at a level that actually keeps them alive, which is expensive and unglamorous. Both are right. A school district wants more funding. The transportation department needs to replace aging infrastructure before it fails. Both are right. A community group wants new affordable housing programs. A fire department is understaffed and needs to hire. Both are right. The budget is where these rights collide against the ceiling of available money.

How to Actually Read Your Budget Without Losing Your Mind

Start small. Don’t try to understand the whole thing at once. Pick one area that matters to you. Parks? Transportation? Housing? Schools? Once you pick a category, search for it in your municipal budget document. Look at this year’s allocation compared to last year’s. That tells you whether things are growing or shrinking. Then look at the narrative sections, usually near the beginning of budget documents. Cities write explanations of their choices. These explanations are where the actual reasoning lives. They’re often written in bureaucratic language, but they’re also surprisingly honest about tradeoffs.

Less than eight percent of residents in smaller cities actually attend or read budget hearings. It’s not because people don’t care. It’s because the materials are genuinely difficult to navigate and the process feels designed for specialists. But that’s changing. A civic transparency platform that handles over fifteen hundred municipalities saw a thirty-four percent increase in resident dashboard logins during this budget season compared to last year. People are trying. More resources exist now to help you understand what your city is actually spending money on. The Government Finance Officers Association Budget Resources offers plain-language guides. Many cities now publish simplified budget summaries alongside the full documents. Some have interactive tools that let you see spending by category or neighborhood. The barrier is lower than it used to be.

What This Actually Means for Your Neighborhood

Your streets are about to change in specific ways determined by decisions made in the last few months. Some of those changes will be visible immediately. Others will take years. Some will satisfy you. Others will frustrate you. Almost all of them are the result of real choices made by people trying to balance genuine competing needs with limited resources. Understanding what your city council actually budgeted for is the first step toward either supporting what they did or advocating effectively for something different next time around.

The next budget cycle starts in a few months in most cities. That’s when you can show up. That’s when you can be one of the eight percent who actually reads the minutes and understands the line items, and advocates for your neighborhood’s priorities rather than just reacting to what happened. But you can’t do that effectively until you understand what happened this time. So read your budget. Find the section that matters to you. See what your city actually chose to invest in. Then come back and tell us what you found. We can figure out what it means together.

The Money Is Actually There (And It’s Waiting)

Here is something that happened while you were probably not reading city council agendas: the federal government decided to spend 450 million dollars on getting people onto electric bikes. Not as part of some flashy national campaign. Not with press conferences or celebrity endorsements. Just quietly, systematically, through the U.S. Department of Transportation’s Active Transportation Infrastructure Investment Program, which funded over 60 municipal e-bike lending and subsidy programs in communities with fewer than 100,000 residents. This is the kind of funding that transforms how a town moves, if someone actually pays attention and puts in the work to apply.

The E-Bike Library Quietly Coming to Your Town: How Your City Can Transform Commutes Without Breaking the Bank

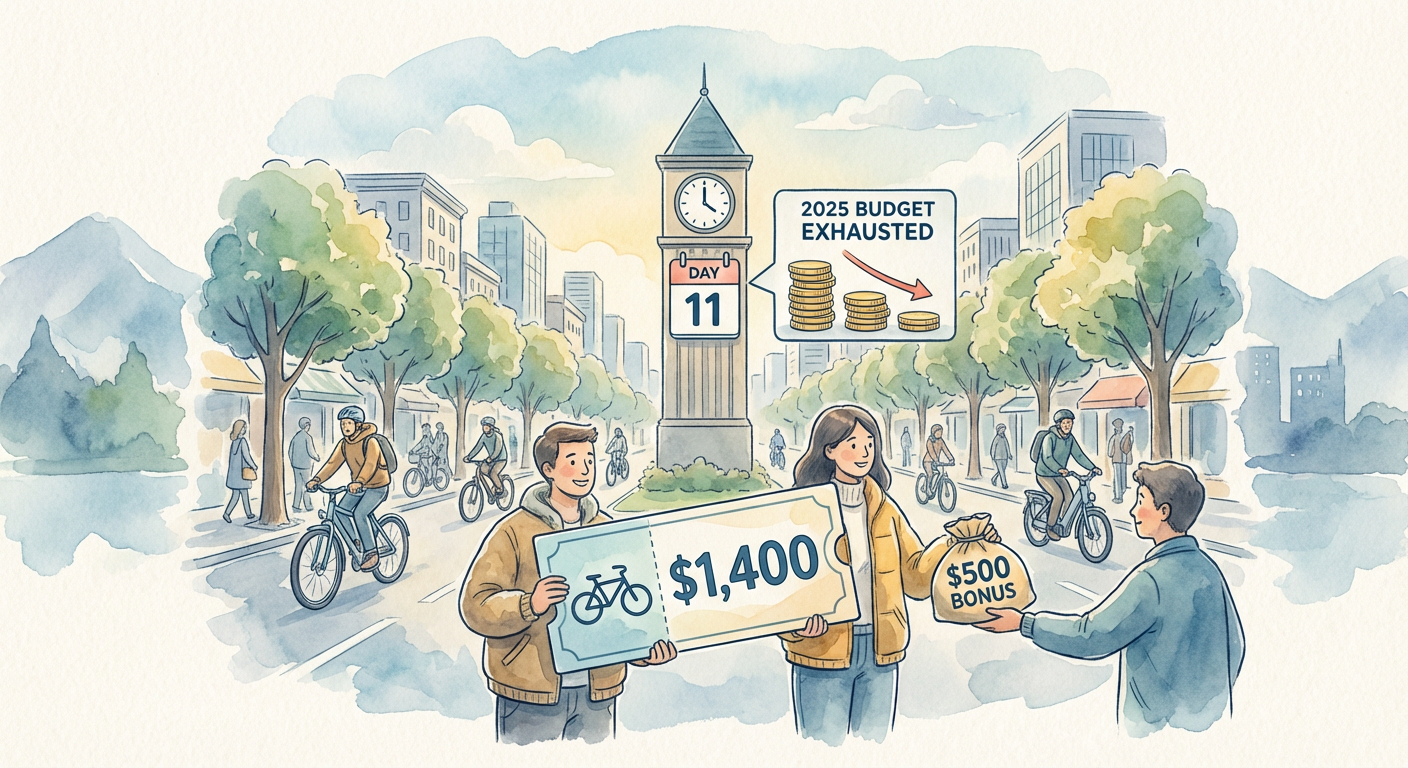
The speed at which this money disappears tells you something important about demand. Denver’s e-bike rebate program, which offered up to 1,400 dollars per bike with an additional 500 dollar bonus for lower-income applicants, exhausted its entire 4 million dollar 2025 budget allocation in eleven days. Eleven days. Not because Denver is some bicycle utopia. Because people wanted to ride bikes. They just needed help affording them. The program didn’t run out because the city was throwing money at a problem nobody cared about. It ran out because the problem was real and the solution actually worked.

Illustration for The E-Bike Library Quietly Coming to Your Town: How Your City Can Transform Commutes Without Breaking the Bank

What Happens When Your Neighbor Gets an E-Bike

This is the part that matters most, and it is measurable. A 2025 study from the University of Colorado Denver tracked what actually happened to people who participated in e-bike programs. Thirty-eight percent of participants reduced their car trips by more than four trips per week. That is not a rounding error. That is someone who used to drive to the grocery store, the gym, the coffee shop, their friend’s house. Now they ride. The infrastructure did not change. The roads are the same. What changed is that the barrier to entry fell away.

The data gets more specific when you look at who benefited most. Lower-income participants showed the highest rates of modal shift, meaning the people who got the most out of the program were people for whom a 1,400 dollar bike represented an actual barrier to getting around. This matters because it means e-bike programs are not solving a problem for the wealthy who could have bought a bike anyway. They are solving it for people whose transportation options were genuinely limited before. That is the definition of infrastructure that works.

How a Library System Became a Bike System

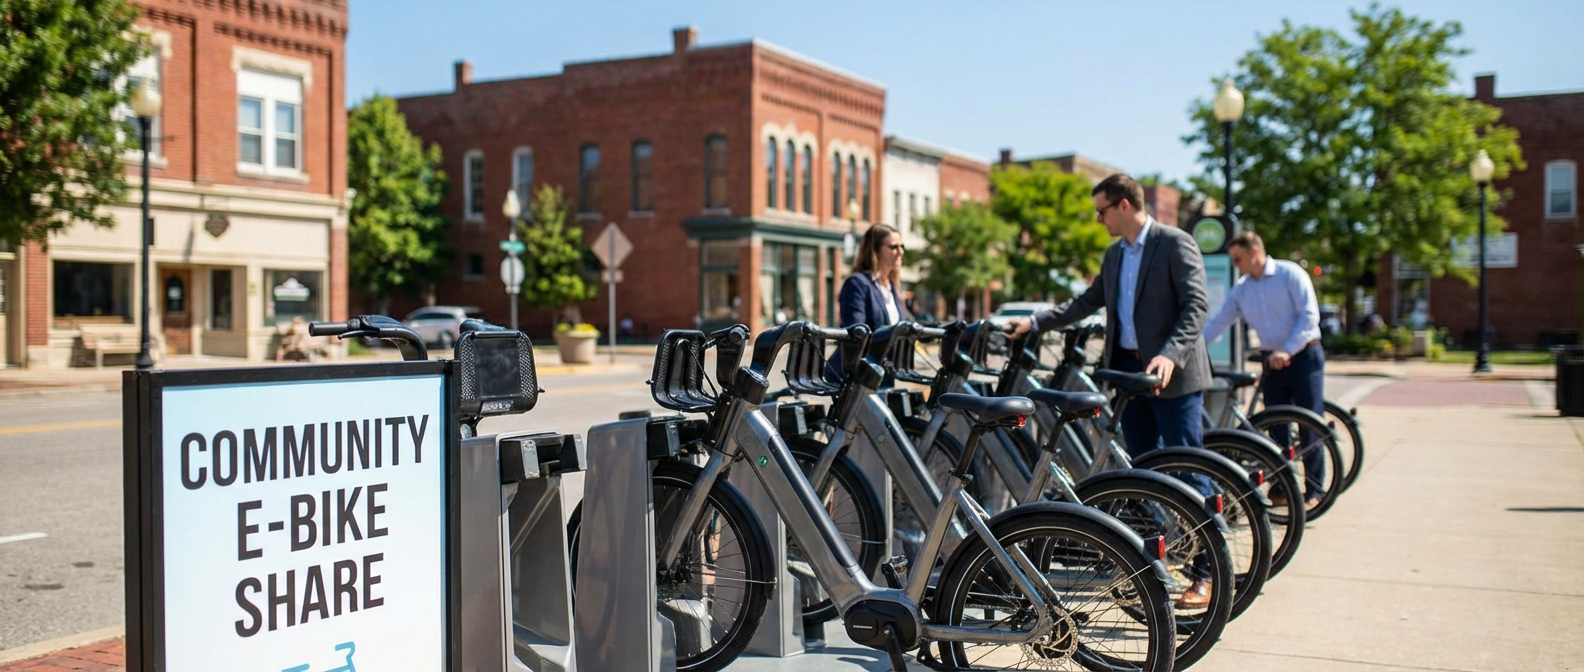
Chattanooga, Tennessee took a different approach entirely. Instead of rebates, the city launched a free municipal e-bike library in March 2025. You check out an e-bike like you check out a book. You need a library card. You reserve online or in person. You ride for a few hours or a few days. You return it. Fourteen neighborhood hubs across the city mean that no matter where you live, there is a place to access a bike. In the first six months, the program recorded 12,000 individual checkouts. That is not 12,000 bikes. That is 12,000 separate trips, which means people figured out that this was worth their time to do again.

The genius of the library model is that it removes multiple barriers at once. You do not have to own a bike. You do not have to maintain it. You do not have to figure out where to store it. You do not have to come up with 1,400 dollars. You just need to know where your nearest hub is, which most people in Chattanooga apparently do. The program works because it meets people where they are instead of asking people to upend their entire life to ride a bike.

The Safety Effect Nobody Expected

Here is something else that happened as municipal e-bike programs expanded: cycling got safer. The League of American Bicyclists State Report Cards tracked cycling-related injury rates in states with active municipal e-bike incentive programs and found an average eleven percent year-over-year decline. This might seem counterintuitive. More bikes on the road. More accidents, right? But that is not what happened. What happened is that e-bikes brought a different kind of rider into the bike lane. People who would never have cycled before now had a tool that made it possible. These riders tend to be slower, more cautious, older, and more visible. They changed the composition of who rides. And somehow, everyone got safer.

The stability of e-bikes matters too. A heavier bike with better weight distribution and lower center of gravity handles differently than a lightweight road bike. Someone riding an e-bike is less likely to wobble into traffic. Less likely to lose control on hills. Less likely to run a stop sign because they need momentum to make it. The infrastructure did not change. The riders did. The streets became safer because the people on them were riding differently.

What This Means for Your Town

So where does this leave you, sitting in your actual town with your actual commute and your actual questions about whether any of this matters. It means that the U.S. DOT Active Transportation Infrastructure Investment Program is still actively accepting applications. It means someone on your city council, or someone who could talk to your city council, could move forward with a rebate program or a lending library or some hybrid nobody has thought of yet. It means there is federal money waiting for municipalities that are willing to do the work of applying.

It also means this is not about whether you are a bicycle person. This is about whether you want to live in a place where transportation options exist. Where a single parent can get to work without sitting in traffic. Where a teenager can get to school without depending on someone else’s schedule. Where an older person can get to the doctor without driving. These are not bicycle problems. These are human problems. The e-bike happens to be the tool that solves them.

The next city council meeting is probably this month. The agenda is probably online. Someone probably needs to raise their hand and ask whether your town has applied for this funding. If you know anything about how your town moves, or how it fails to move, or who gets left behind because movement is too expensive or too difficult, then this conversation matters. The money is real. The results are documented. The question is just whether anyone is paying attention enough to say yes.

The Neighborhood Safety Net That Used to Exist

When the power went out for three days last February, my neighbor Sarah knocked on doors with a handwritten list. “Who has a gas stove? Who needs their insulin kept cold? Anyone have a generator we can share?” Within two hours, we had mapped out which houses could cook, which had medical needs, and who had elderly relatives checking in by phone every few hours.

What struck me wasn’t just how quickly we organized. It was how foreign this felt, even though it should have been second nature. Most of us had lived on the same street for years, but we’d never needed to know these details about each other’s lives. The infrastructure that once made neighbors essential to each other’s survival had quietly disappeared, replaced by systems that work great until they don’t.

What Mutual Aid Actually Looks Like in Practice

Real mutual aid isn’t the romantic image of barn raisings and shared harvests, though those things matter too. It’s Mrs. Chen from three blocks over who started cooking extra rice every Sunday after her husband died, then realized half the international students in the area weren’t eating much on weekends. Now her kitchen feeds twelve people every week, and those same students help her navigate the city’s new recycling app and carry her groceries up two flights of stairs.

The Downtown Neighborhood Network maps this kind of exchange on purpose. They keep a shared spreadsheet that’s part resource directory, part skills inventory. Need someone to translate documents from Mandarin? Call Jin, who needs help winterizing his garden beds. Car broke down? Maria has jumper cables and usually gets off work at 3 PM, but she’s looking for someone to split the cost of bulk laundry detergent from the warehouse store.

This isn’t charity flowing downward from people with extra resources to people without them. It’s horizontal connection between people who all have different combinations of time, skills, access, and need. Jin’s translation work is worth as much as Maria’s jumper cables, which matter as much as Mrs. Chen’s extra rice.

The Infrastructure We Stopped Building

My grandmother’s neighborhood had corner grocers who knew everyone’s usual order and would put items aside for regular customers having a lean week. The local hardware store kept a bulletin board where people posted offers to share tools, split deliveries, or trade services. These weren’t formal mutual aid networks, but they created the social infrastructure that made neighbor-to-neighbor support possible.

We replaced those systems with efficiency and convenience. Box stores and online delivery got rid of the inefficiencies of small-scale commerce, but also the relationships that came with them. Social media promised to connect us, but scrolling past someone’s dinner photos isn’t the same as knowing they haven’t eaten much lately.

The city’s emergency response plans assume we’ll all shelter in place with three days of supplies and wait for official help. But they don’t account for the single parent working two jobs who doesn’t have time to shop for emergency supplies, or the elderly resident whose neighbor used to check on them daily before that neighbor moved away. We optimized for individual self-sufficiency and lost the backup system that comes from being woven into each other’s daily lives.

Building Networks That Work for Everyone

The Riverside Community Resource Hub started in Elena Rodriguez’s living room when she realized three different families on her block were struggling to find reliable childcare for evening shifts. Rather than each family solving the problem alone, they created a rotation where neighbors watched each other’s kids. That core group expanded to include tool lending, bulk buying cooperatives, and skill shares.

What makes their network sustainable isn’t formal organization but clear agreements about how things work. They meet monthly to coordinate, but most of the actual mutual aid happens through a group chat and an old-fashioned physical bulletin board at the community center. People contribute what they can when they can, and receive what they need when they need it, without complicated point systems or formal tracking.

The key thing Elena’s group figured out is that mutual aid works best when it’s part of regular social contact. Their tool library succeeds because people see each other at the monthly potluck. The childcare network thrives because the kids already know each other from playing outside together. The bulk buying works because they’re already coordinating through the group chat for other things.

Starting Where You Are

You don’t need to launch a formal organization to begin building mutual aid in your area. Start by noticing what resources and needs already exist around you. The neighbor who works from home and gets packages delivered daily might appreciate having someone available to receive deliveries for people who work outside the home. The person with the pickup truck probably knows other people who occasionally need to move furniture or haul yard waste.

The Eastside Neighborhood Exchange began when Tom started a simple group text to coordinate sharing his snow blower. Within six months, that text chain included twenty households sharing everything from power tools to pet sitting to rides to medical appointments. They never formally decided to become a mutual aid network. They just kept saying yes when people asked for small favors and kept asking when they needed help.

The most successful networks I’ve seen start with people who already have some reason to be in regular contact, whether that’s living on the same block, sending kids to the same school, or shopping at the same corner store. They build slowly, adding new members through existing relationships rather than mass outreach campaigns.

Next time you’re wondering where your neighbors are when the power goes out or the grocery store runs out of basics, remember that those connections don’t build themselves overnight. They grow from the much smaller practice of knowing who around you has what skills, what struggles, and what extra capacity to help when help is needed.

The Room Where It Happened

Last Tuesday’s environmental health committee meeting should have been straightforward. The agenda listed one item: reviewing the city’s updated air quality monitoring data. What happened instead was something I’ve been thinking about all week. Three different groups presented three different maps of our city, each showing air pollution data, and somehow they barely looked like the same place.

The city’s environmental department showed improvement across most neighborhoods, with neat color gradients suggesting steady progress. The Eastside Residents Coalition presented data focusing on the industrial corridor, with stark red zones marking areas where children can’t play outside on bad air days. Meanwhile, the Chamber of Commerce’s consultant highlighted economic impacts and compliance rates, painting a picture of regulatory burden rather than health risk. Same data sources. Wildly different stories.

Where the Lines Get Drawn

The disconnect isn’t about bad faith or hidden agendas. It’s about how we define the problem itself. When the city maps air quality, they’re averaging readings across census tracts, smoothing out hot spots to show overall trends. That makes sense for regional planning, but it hides the reality that pollution doesn’t spread evenly. The truck route that runs behind Lincoln Elementary creates a pocket of diesel particles that disappears when averaged with the residential streets six blocks away.

The residents’ coalition focuses on what they call “fence line communities” – the neighborhoods that bump up against industrial facilities, highways, and freight corridors. Their mapping highlights cumulative exposure: not just air quality on any given day, but the compound effect of living with multiple pollution sources over years. When Maria Santos from the coalition spoke about her daughter’s asthma attacks correlating with port activity, she wasn’t just sharing an anecdote. She was describing a pattern that becomes visible only when you map health outcomes alongside pollution sources over time.

The business community’s maps emphasize compliance and economic context. Their consultant pointed out that local facilities meet federal standards and provide family-wage jobs. That’s not wrong, but it frames environmental justice as a trade-off between health and economic opportunity rather than a design challenge about how to achieve both.

The Infrastructure Behind the Disagreement

Here’s what I learned digging into the city council minutes from the past two years: our monitoring system was designed in the 1990s to track regional air quality trends, not environmental justice impacts. We have twelve permanent monitoring stations across a city of 180,000 people, positioned to capture representative samples for federal reporting requirements. None of them are in the neighborhoods that experience the highest pollution loads.

This isn’t an accident. It’s how environmental monitoring was originally conceived: as a way to track overall air quality trends and ensure compliance with federal standards. The system works well for those purposes, but it wasn’t designed to identify unequal impacts or guide targeted interventions. When the Eastside coalition requested additional monitoring stations near the rail yard and cement plant, they were asking for a completely different kind of data collection.

The city’s response reveals the structural challenge: adding monitors costs money, but more importantly, it would likely reveal problems that current regulations don’t address. If hyperlocal monitoring shows that certain neighborhoods experience pollution levels significantly higher than the citywide average, what then? Federal standards still apply uniformly, and city authority over industrial facilities remains limited.

What Actually Works

Richmond, California faced a similar mapping problem fifteen years ago when residents around the Chevron refinery organized around air quality concerns. Their solution wasn’t just more monitors, it was community-controlled monitoring. Residents were trained to operate low-cost air sensors and track health impacts in real time. The data they collected didn’t replace official monitoring, but it filled in gaps and created accountability that wouldn’t have existed otherwise.

That model is catching on here. The Eastside coalition recently received a small grant to pilot community air monitoring using sensors that cost $200 each instead of $20,000. The data won’t be regulatory-grade, but it will be detailed and resident-controlled. More importantly, it creates a framework for neighbors to document their own experiences and advocate for specific solutions.

Meanwhile, the city is exploring what they call “health in all policies” – reviewing development proposals and infrastructure projects through an environmental justice lens before approval rather than trying to fix problems after the fact. The new freight route analysis includes cumulative impact assessment, considering how additional truck traffic would affect neighborhoods that already bear unequal pollution loads.

Beyond the Maps

The most promising development isn’t technical, it’s social. After last Tuesday’s meeting, representatives from all three groups agreed to form a working committee that meets monthly to review data together and identify shared concerns. It’s not consensus-building in the feel-good sense, but rather recognition that their different maps reflect different but legitimate concerns about the same underlying problems.

The next committee meeting is November 15th at the Eastside Community Center, and they’re planning to walk the neighborhoods represented in their different maps. Sometimes the best way to resolve disagreements about data is to look at the places the data represents. If you want to understand how environmental justice works in practice, that’s where to start.

The question isn’t which map is right. It’s whether we can use all three to build something better than what any of them shows alone.