I’ve lived in six different neighborhoods over the past twenty years, and I can tell you this: the difference between a house and a home often comes down to the people living next door. When my family moved into our current place, we didn’t know a single person on the block. Within a year, we had friends who checked on our kids, shared garden harvests, and made every evening walk feel like a reunion. That didn’t happen by accident.

Neighbors chatting on a suburban sidewalk

Why Neighbor Relationships Matter More Than We Think

Most of us walk past our neighbors’ homes dozens of times a week without really seeing the people inside. We’re busy, tired, or just not in the habit of reaching out. But research from Pew Research Center shows that only about 26% of Americans know most of their neighbors by name. That number has been dropping for decades, and the consequences are real: loneliness, isolation, and communities that feel more like collections of strangers than neighborhoods.

When you know your neighbors, everything changes. You feel safer walking at night. Your kids have more adults watching out for them. You have someone to call when the power goes out or when you need a cup of sugar at nine in the evening. Building these relationships isn’t complicated, but it does take intention and a willingness to be a little vulnerable.

Start Small: The Power of a Simple Greeting

The strongest connections I’ve made with neighbors all started the same way—with a wave, a nod, or a simple “hello.” You don’t need to organize a block party or knock on every door with a casserole. Start by acknowledging the people around you.

When you’re getting the mail, walking the dog, or taking out the trash, look up and greet whoever’s nearby. Say their name if you know it. Ask how their day is going, and actually pause to hear the answer. These brief exchanges seem small, but they accumulate. Over weeks and months, they create a foundation of familiarity and warmth that makes deeper conversation feel natural rather than forced.

Make Yourself a Familiar Face

Spend time in shared spaces. Sit on your front porch instead of the back deck. Walk your neighborhood at different times of day. Work in your garden where people passing by can see you and stop to chat. Visibility matters. When neighbors see you regularly, you become part of the fabric of the place rather than a stranger behind a closed door.

I made a habit of drinking my morning coffee on the front steps, and within a few weeks, three different neighbors had stopped to introduce themselves. One of them, Margaret, has since become like family. It all started because I chose a spot where people could find me.

Be Present When It Counts

Neighbors helping each other carry groceries

Showing up is half the battle. When my neighbor Dave was clearing fallen branches after a storm, I walked over and grabbed a rake. We didn’t talk much—just worked side by side for thirty minutes. The next time I saw him, he waved me down to offer extra tomatoes from his garden. That quiet willingness to help without making a big deal of it builds trust faster than any social event ever could.

Pay attention to what’s happening around you. If someone’s moving in, offer to carry a box. If a neighbor is dealing with a loss, drop off a meal. If there’s a community meeting about a local issue, attend and speak up. These moments of presence tell people that you’re invested in the place where you live and the people who share it with you.

Follow Through on Small Promises

If you tell a neighbor you’ll keep an eye on their house while they’re gone, do it. If you say you’ll return that borrowed tool on Thursday, make sure it’s on their porch by Thursday evening. Trust is built in tiny, consistent actions over time. People remember when you follow through, and they remember when you don’t. Be the neighbor whose word means something.

Share Something Real

Sharing is one of the oldest and most natural ways people connect. It doesn’t have to be grand. Share a bag of lemons from your tree. Share a recommendation for a good plumber. Share your time by offering to walk a neighbor’s dog when they’re sick. Share your knowledge by teaching someone how to fix a leaky faucet.

Food is especially powerful. A plate of cookies, a jar of homemade jam, or an invitation to share a pot of soup on a cold evening—these gestures carry warmth and care in a way that almost nothing else does. When my wife bakes her sourdough bread, she always makes a little extra for the folks next door. It’s not about the bread itself. It’s about the message: I thought of you, and I wanted you to know you matter to me.

Listen More Than You Speak

Here’s something I’ve learned the hard way: authentic relationships aren’t built by being the most interesting person in the room. They’re built by being the most interested. When a neighbor tells you about their renovation project, their kid’s college application, or their aging parent, really listen. Ask follow-up questions. Remember what they told you and check in later.

Listening is an act of generosity, especially in a culture that constantly pushes us to broadcast ourselves. When you give someone your full attention—without glancing at your phone or steering the conversation back to yourself—you give them something rare and valuable. You make them feel seen and heard, and people never forget how you made them feel.

Respect Boundaries While Building Trust

Two neighbors having a relaxed conversation on a porch

Not everyone wants to be close friends with their neighbors, and that’s perfectly fine. Authentic relationships don’t mean no boundaries. They mean respecting boundaries while still staying open to connection. Read the room. If a neighbor gives short answers and doesn’t make eye contact, they might just want friendly distance. Honor that. A warm wave and a “good morning” might be exactly what they need, nothing more.

On the other hand, if someone lights up when you stop to talk, leans into the conversation, and starts sharing personal stories, that’s an invitation. Take it gently. Let the relationship grow at its own pace. Forcing closeness always backfires. Authenticity can’t be rushed.

Navigating Differences with Grace

Your neighbors won’t always look like you, think like you, or live like you. That’s not an obstacle—it’s an opportunity. Some of the richest relationships I have are with people whose backgrounds, beliefs, and daily rhythms are completely different from mine. We don’t agree on everything, and we don’t need to. What we share is a street, a community, and a mutual desire to look out for each other.

When differences arise—and they will—approach them with curiosity rather than judgment. Ask questions instead of making assumptions. Assume good intent. A neighbor who plays loud music on Saturday nights isn’t necessarily inconsiderate; they might just have a different idea of what weekend living looks like. A conversation rooted in respect almost always goes further than a complaint.

Stay in It for the Long Haul

Building real relationships with neighbors isn’t a one-time effort. It’s a practice, something you return to day after day, season after season. There will be stretches where everyone’s too busy to connect, and that’s normal. What matters is that you keep reaching out, keep showing up, and keep treating the people around you as more than just faces in passing cars.

Over time, you’ll find that these relationships become some of the most grounding connections in your life. Not because neighbors replace close friends or family, but because they occupy a unique space—people who share your immediate world, who notice when something’s off, who celebrate your small wins and steady your rough patches. That kind of closeness can’t be ordered online or found on an app. It grows right where you are, one genuine interaction at a time.

Frequently Asked Questions

What if I’m introverted and find it hard to approach neighbors?

Start with low-pressure interactions. A simple wave, a nod, or leaving a note with your phone number on a neighbor’s door takes much less energy than a face-to-face conversation. You can also share something anonymously—a small treat on a doorstep with a kind note—to test the waters. Many introverts find that their deepest connections come from one-on-one conversations rather than group settings, so focus on building individual relationships at whatever pace feels comfortable.

How do I handle a neighbor who seems unfriendly or uninterested?

Give them space while staying consistently polite. Some people take longer to warm up, and others simply prefer more distance with their neighbors. Keep offering a friendly greeting when you cross paths, but don’t push for more. Sometimes what seems like unfriendliness is actually shyness, cultural difference, or a person going through a difficult season. Over time, consistent warmth can soften even the most guarded neighbor.

Is it worth trying to connect with neighbors if I plan to move soon?

Absolutely. Short-term connections still matter, and practicing neighborly habits wherever you go makes you better at building community in the long run. Plus, you never know—those brief relationships sometimes turn into lasting friendships that span moves, cities, and even decades. And if nothing else, being a good neighbor for the time you’re there simply makes daily life more pleasant for everyone, including you.

What We’re Actually Losing When Whole Buildings Turn Into Hotels

There’s a particular quiet that settles over a neighborhood when the long-term renters leave. It’s not the absence of noise exactly. It’s the absence of routine. No one waters the same plants on the same fire escape anymore. The bodega owner stops memorizing which customers take their coffee with an extra shot. The stoop conversations that used to happen every evening at seven o’clock just stop happening because there’s no “every evening” anymore, just a rotating cast of people who checked in yesterday and leave tomorrow.

This is what happened to blocks across New York City, Nashville, and Barcelona over the past several years, and it’s what we’re watching happen to neighborhoods everywhere as short-term rental platforms transformed residential buildings into de facto hotels. The financial numbers tell one story. The social infrastructure story is different. Both matter, and both are finally getting the enforcement attention they should have received years ago.

New York Proves the Model Works, Even When It’s Messy

New York City passed Local Law 18 back in 2023, and if you’ve been paying attention to the legal challenges and the pushback from platform companies, you might think it failed. It didn’t. The law required that short-term rental hosts be the owner-occupants of the apartments they were renting out. No more investor-owned buildings running as unlicensed hotels. No more entire floors controlled by management companies.

By 2025, after the courts upheld the law through multiple legal challenges, the results were stark. The city went from approximately 22,000 Airbnb listings to under 3,500. That’s not a market correction. That’s a structural change. According to the NYC Comptroller Short-Term Rental Impact Report released in early 2025, neighborhoods that had been saturated with short-term rentals saw median asking rents drop by 6.3% within 18 months. That sounds small until you realize what it means in practice: a two-bedroom that would have rented for $3,200 a month a year ago now rents for $3,000. In a city where housing affordability is a five-alarm fire, that’s not theoretical. That’s people staying in their apartments instead of being displaced.

The enforcement was expensive and imperfect. The city had to hire inspectors. There were false reports and bad-faith complaints. Hosts fought back. Some buildings had to go dark entirely because their owners couldn’t comply. But underneath all the friction was a basic principle that finally got enforced: neighborhoods are supposed to be places where people live, not places where tourists circulate through furnished apartments.

Nashville and Barcelona Show the Patterns Repeating Across Geographies

Nashville’s experience tracks New York’s almost precisely, just with different numbers and a slightly different timeline. The city updated its short-term rental ordinance in late 2024 and followed up with serious enforcement in 2025. The Metro Nashville Finance Department reported that the enforcement sweep revoked licenses for 1,240 non-owner-occupied properties and collected $2.1 million in fines. That’s not deterrence theater. That’s actual regulation.

But Barcelona took it further. In November 2025, the city announced that it would not renew any of its 10,101 short-term rental licenses when they expire in 2028. Every single one. The city is essentially choosing to exit the short-term rental market entirely rather than trying to manage it with restrictions. The reasoning wasn’t complicated: Barcelona’s neighborhoods weren’t functioning as neighborhoods anymore. The tourism economy had colonized the residential fabric so thoroughly that landlords had no incentive to rent long-term. Why rent to someone who needs stability when you can rent to someone for three weeks at a time, change the sheets, and do it again?

The Data Shows What Happens to Housing Markets When You Actually Enforce

The research is getting clearer. Harvard JCHS Housing Research from 2025 analyzed fifty American cities and found that each 1% increase in Airbnb listing density was associated with a 0.018% increase in local long-term rental prices. That doesn’t sound like much until you layer it onto a city with very few available rentals. In markets where vacancy rates are under 3%, those small percentage increases compound. They lock people out. The National Association of Realtors added another data point: cities with active short-term rental enforcement saw investor-owned single-family home purchases for rental conversion fall by 14% compared to cities without restrictions. That matters because it means fewer mom-and-pop landlords are selling their buildings to investment funds that immediately convert them to short-term rentals.

The mechanism is straightforward. When enforcement is weak or nonexistent, investors buy properties specifically because they can run them as hotels. They’re betting on nightly rates, not monthly stability. Once enforcement gets serious, that business model becomes risky. Some of those properties come back on the market as legitimate rentals. Some get redeveloped. Some just sit while the investor waits to see if the law gets rolled back. But the incentive structure shifts. The financials change. And neighborhoods get a chance to function again.

What This Means for Your Block, and What You Can Actually Do About It

If your neighborhood still has a thriving short-term rental scene, the enforcement wave is coming. Some cities will pass laws this year. Some next year. It’s following a clear pattern now, and the legal precedent is established. New York won in court. That matters. So if you’re tired of hearing foreign languages in the hallway at 2 AM, or if you’ve watched rents climb while your neighbors get priced out, or if your block just doesn’t feel like a place anymore but more like a rotation, you have leverage you didn’t have five years ago.

The practical stuff: attend your community board meetings. Read the housing committee minutes. If your city doesn’t have short-term rental restrictions, there are likely people already working on them. If it does, understand what they are and whether they’re being enforced. Call your council member’s office and ask specifically about enforcement, not just legislation. Ask about inspector hiring. Ask about fines collected. These conversations only happen when residents ask them. And they’re not theoretical anymore. They’re backed by data from three major cities that proves the model actually works.

Neighborhoods are made of routines and relationships and the slow accumulation of shared experience. You can’t measure most of what makes a place work. But you can measure whether long-term residents are being pushed out, whether rents are climbing, whether investors are still buying buildings to run as hotels. You can measure enforcement. And when cities actually enforce it, those rents stabilize and those residents stay. That’s not nostalgic thinking. That’s housing policy that works. If you want to see it happen on your block, now is the time to start pushing.

The Problem We’ve All Watched Unfold

You know the story. A neighborhood you loved becomes unrecognizable. Long-time residents who raised their families there can no longer afford the rent. Teachers, nurses, artists, the people who actually make a community function, get pushed further and further out. Meanwhile, housing sits empty or gets flipped for profit, and the city council meetings about zoning feel like theater because nobody has the actual tool to stop the displacement.

The traditional market alone isn’t fixing this. Market-rate development happens when it’s profitable, which means it rarely happens in the neighborhoods that need it most. And rental assistance, while crucial, is a perpetual Band-Aid rather than a structural solution. You can rent-stabilize your way into the next fiscal year, but you cannot build stable communities that way.

This is where community land trusts enter the conversation. Not as a sexy solution you’ll see splashed across TechCrunch, but as a quietly effective mechanism that’s actually working at scale in hundreds of American communities right now.

What a Community Land Trust Actually Does (And Why It Works)

A CLT is fundamentally a different ownership model. The trust acquires land—either through purchase or donation—and then holds it permanently on behalf of the community. Individual residents or organizations can own the buildings on that land, but the land itself stays in the trust. When a homeowner sells, the property stays affordable for the next buyer because the affordability is baked into the land itself, not dependent on the market.

This structure solves a real problem that gets overlooked in most housing conversations. Traditional affordable housing often comes with a timeline. A developer builds affordable units with a subsidy, meets their obligation for 30 years, and then the property can convert to market rate. CLTs remove that expiration date. The affordability persists across decades and ownership changes.

The numbers tell this part of the story. During 2024, homeowners in the Champlain Housing Trust in Burlington, Vermont—one of the oldest and most established CLTs in the country—built an average of $14,000 in equity despite the regional market being essentially flat. These were real people accumulating real wealth through homeownership, which is exactly what affordable housing policy should accomplish but rarely does. Compare this to foreclosure rates: CLT homeowners experienced a 0.6% foreclosure rate during the recent interest rate surge from 2022 to 2024, while comparable market-rate homeowners faced a 3.8% foreclosure rate. The difference is systemic. The CLT structure stabilizes ownership.

The Momentum Is Accelerating

The scale has shifted noticeably. Over 300 community land trusts now operate across the United States, a 25% increase since 2020. The largest growth has happened in the South and Midwest, regions you might not immediately associate with housing innovation. This isn’t a coastal phenomenon anymore. It’s happening in cities and rural areas where housing costs have risen faster than incomes, which is almost everywhere at this point.

Federal support has arrived too, though quietly. HUD’s 2025 Community Development report allocated $35 million specifically toward CLT capacity building grants. This is the first dedicated federal CLT funding stream in more than a decade. That money matters because it helps newer trusts build infrastructure, hire staff, and scale operations without immediately having to pull from limited local foundations.

Look at Atlanta’s Westside Future Fund. Launched in 2017, this CLT had preserved over 300 affordable units by 2025 in neighborhoods where median home prices rose 62% during the same period. Think about what that means. The neighborhoods gentrified hard. Prices exploded. And yet 300 families maintained affordable housing in those exact neighborhoods because the CLT structure protected them. This isn’t theoretical impact.

If you want to see what exists near you and get a sense of the movement, the Grounded Solutions Network Community Land Trust Database is comprehensive. You can search by state and city and see what’s actually operating in your region.

Why Your City Probably Doesn’t Have One Yet (And What That Means)

So if CLTs work and the movement is growing, why doesn’t your city have one? Several reasons, mostly unglamorous.

First, CLTs require patient capital and a long time horizon. You cannot get rich quick with a CLT because the model explicitly captures value for homeowners and long-term community stability instead of investors. Second, they require real government support: land donations, zoning flexibility, financing help. Governments that treat housing as purely a market problem don’t naturally gravitate toward CLTs. Third, they need experienced staff and governance. Starting a CLT from scratch is harder than it looks, even with good intentions.

But the research, including analysis from the Lincoln Institute of Land Policy on CLTs, shows the model works at sufficient scale to matter. You’re not betting on an unproven concept. You’re choosing whether to adopt a tool that hundreds of other communities have already validated.

What You Can Actually Do Right Now

If you want to explore this for your community, start with research. Find out if a CLT already exists where you live. If one does, attend a meeting or take a tour of a property they manage. The people who run CLTs are unusually straightforward about how they work and what they’re trying to accomplish. There’s no sales pitch, just explanation.

If one doesn’t exist, contact your city’s planning or community development department and ask whether CLTs have been discussed in recent housing policy conversations. Ask directly. Read the city council minutes. See what’s in the comprehensive plan. Then connect with your local affordable housing coalition or community development corporation—those organizations usually know the landscape and often have opinions about whether a CLT makes sense locally.

This isn’t something you fix by yourself over a weekend. But it’s not hopeless either. CLTs exist because people in hundreds of communities looked at their housing crisis and decided to try a different approach. The tool works. What matters now is whether your community chooses to use it. That choice starts with asking the question.

You Notice It First as a Feeling, Then as Empty Storefronts

There’s a coffee shop on Main Street that used to be where you ran into people. Not friends necessarily, but the kind of familiar strangers who made a place feel alive. The barista knew your order. You’d bump into the retired teacher who volunteered at the library, or the small business owner who always had something interesting to say about the city council meeting from last week. That shop closed in November. A vape store sits empty next to it now. The bookstore across the street held on until February.

You’re not imagining that your town feels lonelier. The data confirms it, and it’s worth understanding why, because the pattern is happening everywhere at the same time, driven by forces your community can actually push back against if you know what you’re looking at.

What We’ve Lost, Measured in Closures and Loneliness

Ray Oldenburg, the urban sociologist who first named the concept of the “third place” back in 1989, published updated research in 2024 that should disturb anyone who cares about how we live together. Only 22 percent of Americans now report visiting a non-home, non-work social space on a weekly basis. In the year 2000, that number was 41 percent. That’s not a gradual decline. That’s a collapse happening in real time, and it’s accelerating.

The U.S. Surgeon General Advisory on Loneliness and Isolation released in 2025 added another layer of context: the number of Americans reporting they have no close friends has quadrupled since 1990. The sharpest increases are in suburban communities, which makes sense when you think about it. Suburbs were designed without third places. They were designed for cars and private yards and isolation, and we’re now living with the consequences of that design choice.

But here’s what gets buried in the national statistics: the specific, local reason your particular coffee shop or bookstore or community center closed wasn’t some vague cultural shift. It was usually economics. Commercial rent increases averaging 18 percent since 2022, according to the National Coffee Association’s 2025 report. Independent coffee shops specifically saw 4,200 net closures nationally in 2024. That’s not because people stopped drinking coffee. It’s because landlords could charge more to chains, or because the building got sold to a developer, or because a small business owner couldn’t absorb another 20 percent jump in monthly overhead.

The Measurement Problem: How Do We Know Which Communities Are Actually Dying?

The Project for Public Spaces, which does real placemaking work in cities across the country, released their 2025 Placemaking Index, and the results should be a wake-up call for anyone in a mid-sized community. Out of the hundreds of American cities evaluated, only 11 scored high enough to be classified as having “healthy third place ecosystems.” Most mid-sized cities scored below 40 out of 100. Most. That’s not failure in a few places. That’s systemic failure across the entire country.

What matters about this data, though, is that the index is measurable, which means it’s fixable. Project for Public Spaces Placemaking Resources breaks down exactly what they’re looking for. Are there multiple venues where people can gather? Are they accessible by walking or transit? Are they safe? Do they serve people across different age groups and income levels? Can you actually sit and talk, or is the environment designed to move people through quickly?

When you look at your own town through this lens, you stop seeing the problem as inevitable cultural decline and start seeing specific, addressable planning failures. The coffee shop closed because of rent. The park has no seating. The community center hours don’t match when working people can actually get there. These are solvable problems, but you have to name them first.

What Actually Works: Two Cities That Decided to Do Something

In 2025, Tempe, Arizona and Raleigh, North Carolina both launched what they called “Third Place Activation Grants.” The amounts were modest: $5,000 to $25,000 per venue. The goal was straightforward: help small community venues offset rent increases so they could stay open. The results were specific enough to be useful. Twelve months later, 87 percent of the Tempe grant recipients were still operating.

This matters because it proves the problem is solvable with actual resources and actual planning, but also because it shows what the work looks like on the ground. Both cities had to do research first. They had to identify which venues were actually functioning as third places. They had to understand the landlord economics. They had to figure out what the difference between a $5,000 grant and a $25,000 grant actually meant in practice for a small business. They didn’t just throw money at the problem. They thought about it structurally.

And then they had to go to city council and argue for it. They had to explain to skeptical people why a coffee shop mattered enough to spend municipal funds on it. They had to make the case that loneliness is not a personal failing but a design problem, and that fixing design problems is something government can actually do.

What Your Community Can Do Right Now

You probably don’t have the authority to create city grants, but you can do the research that makes those grants possible later. Start by walking around your town with the Placemaking Index in mind. Where can people actually sit and talk for free or cheap? Are those places accessible to people without cars? Are they welcoming to people of different ages? Write down what you find. Talk to the owners of the places that are still working. Ask them what their rent is, when they pay it, and what would actually keep them alive.

Connect with other people who care about this. It’s not work you do alone, which is kind of the whole point. Take those observations to your city council member. Show them the data. Ask them what Tempe and Raleigh are doing that your city isn’t. Propose a listening session where business owners can talk about what they need. Put the question directly: do we want to be a place where people gather, or are we okay with being a place where everyone stays home?

The coffee shop closing wasn’t fate. Your town feeling broken isn’t inevitable. It’s the result of specific choices about what we fund, what we value, and what we’re willing to pay attention to. Those choices can change, but it starts with looking at the data, understanding what it means, and deciding to do something about it. The work is real. It’s also doable. What are you waiting for?

What Oxford’s Traffic Filters Actually Changed

If you’ve been following the Oxford pilot program that launched in 2022, you’ve probably heard the term “traffic filter” thrown around at neighborhood meetings. Here’s what actually happened: the city installed barriers that prevent through-traffic in certain residential zones during specific hours. For three years, Oxfordshire County Council Traffic Data tracked the results. The findings show a 14 percent reduction in car journeys through filtered neighborhoods. That’s not earth-shattering, but it’s real, and it matters more than you might think.

A 14 percent reduction doesn’t mean cars vanished from the streets. It means some people changed their behavior. Some found alternate routes. Some combined trips. Some shifted to other transportation methods. The traffic didn’t disappear — it was redistributed. This is exactly where the conversation gets complicated, and also exactly where your neighborhood probably sits right now. The question isn’t whether 15-minute city principles work. The question is whether the tradeoffs are worth it to the people actually living there.

The Reality Beyond the Headlines

Researchers at MIT’s Senseable City Lab studied ten European cities that implemented 15-minute city design principles and found that residents reduced their daily car travel by an average of 22 minutes per day when the infrastructure was fully built out. That’s substantial. But here’s the word that matters: fully. It took years, not months. It required reliable public transit, usable bike lanes, grocery stores within actual walking distance, and medical clinics you could reach without a car. Most cities don’t have that. Most neighborhoods don’t either.

The gap between theory and practice is where your life actually happens. A city can draw beautiful maps showing how everything connects in fifteen minutes. But if the bus runs every thirty minutes and the grocery store closes at 6 p.m., the math doesn’t work for someone working a retail shift. If the only bike route requires crossing four lanes of traffic, families won’t use it. This is why looking at real pilot data matters. It shows you what actually changed, which tells you what needs to happen next.

What Other Cities Are Learning (And the Money It Takes)

Portland, Oregon took a different approach entirely. In 2025, they allocated forty-eight million dollars across twelve underserved neighborhoods, specifically targeting the areas that failed their walkability audits. Instead of implementing traffic restrictions first, they started by identifying where people couldn’t reach essential services without a car. They funded new grocery access, transit improvements, and street redesigns. The 87 member cities in the C40 Cities 15-Minute City Framework collectively represent over 700 million residents, and most of them discovered the same thing: you can’t restrict car access to neighborhoods that lack alternatives.

Portland’s investment reveals the actual cost of making this work. Forty-eight million dollars for twelve neighborhoods. Do the math for your city. The reason many 15-minute city conversations stall isn’t ideology. It’s logistics and funding. You can restrict traffic tomorrow with bollards and signs. You can’t install reliable transit or new businesses in weeks or months. This matters for your commute because it determines whether this stays a debate or becomes real change.

The Neighborhood Support Numbers (And What They Don’t Tell You)

A Pew Research Center survey from late 2024 found that 61 percent of Americans say they support walkable neighborhood design. That sounds solid. But the same survey showed that 44 percent oppose any restrictions on car access to achieve it. These aren’t completely different groups either. Many people support the goal but reject the method. They want walkability without inconvenience. They want less traffic on residential streets but full car access. They want neighbors using transit without losing their own parking. This contradiction lives in most neighborhoods.

Understanding this helps you understand your neighborhood’s actual position. You likely aren’t in disagreement about whether walkability matters. You’re probably working through what happens to the person who needs to drive, who can’t afford a bike, or whose job doesn’t align with transit schedules. These are real constraints. Acknowledging them doesn’t mean abandoning the goal. It means designing solutions that don’t assume everyone looks the same or lives the same life.

What You Actually Need to Know About Your Own Streets

Before anything changes in your neighborhood, you need a clear picture of what’s already working and what isn’t. Walk or bike your current routes. Where do they go? Do they connect to schools, medical offices, grocery stores, or libraries? How long do these trips actually take? Time them. Talk to your elderly neighbors, to people who don’t drive, to families without cars. Ask delivery drivers and service workers what routes they use. This data is more valuable than any city council report because it’s specific to your actual neighborhood.

Then look at the transit question honestly. How often does the nearest bus run? How reliable is it? Does it go where people actually need to go? If a 15-minute city framework is going to work where you live, public transportation has to improve first. Traffic restrictions can follow, but they’re not the starting point. The starting point is making alternatives real and reliable. That might mean advocating for better bus service or a new pedestrian path. It might mean working with neighbors to create a community bike repair station. It might mean pushing the city to open fresh food access in your area. These are the conversations that matter most.

The Oxford data is useful, but it’s Oxford’s data, not yours. Portland’s forty-eight million dollar investment is happening in Portland. Your commute, your neighborhood, your life exists in a specific place with specific constraints and specific opportunities. Read the city council minutes. Ask questions about what’s actually planned for your area. Talk to neighbors at coffee shops and on your street. Then decide what you’re willing to support and what you want to change. That’s where real community engagement lives.

The Money Is Real, The Clock Is Ticking, And Your Community Might Miss It

There is forty-two billion dollars sitting on the table right now. That is not hyperbole or a political talking point. The Broadband Equity, Access, and Deployment Program, administered by the National Telecommunications and Information Administration, represents the largest federal investment in broadband infrastructure in American history. If your town does not have gigabit internet, or if your community is one of the roughly fourteen and a half million American locations still lacking basic broadband access, this money was theoretically designed with you in mind.

The $42 Billion Broadband Rush: Why Your Town Needs to Act Now (And Why It's Complicated)
The $42 Billion Broadband Rush: Why Your Town Needs to Act Now (And Why It’s Complicated)

But here is the thing about government money: it does not distribute itself. It sits in accounts and programs and state implementation plans, waiting for communities to apply, to advocate, to show up in the right rooms at the right time. Some towns have already figured this out. Louisiana and Virginia moved quickly through their BEAD planning processes and positioned themselves to begin actual construction contracts in late 2025. Meanwhile, other communities are still asking their city council members what BEAD even stands for.

The real deadline anxiety does not stem from money running out tomorrow. It comes from state implementation plans. By early 2026, approximately thirty-eight states had received approval for their BEAD plans from the federal government. That approval matters enormously, because it unlocks the actual distribution of funds to local providers and municipalities. If your state has not yet finished its plan, or if your community has not made itself visible within that plan, you are already playing catch-up.

Understanding the Gap: Who Is Actually Without Broadband, and Why It Matters

The FCC updated its broadband mapping data in June 2025, and the picture remains stubbornly uneven. Fourteen and a half million locations across the United States still lack access to twenty-five megabits per second download and three megabits per second upload speeds. That is the federal minimum definition of broadband. These locations are not scattered randomly. They cluster in rural areas, on tribal lands, and in regions where the economics of infrastructure investment have never made private companies particularly interested.

This is where disagreement begins, even among people who want to solve the problem. Some rural advocates argue that the BEAD Program’s funding levels, while historic, still underestimate what it actually costs to build fiber networks across sparsely populated terrain. A provider serving five hundred people across fifty square miles faces entirely different economics than one serving five thousand people in the same space. Rural stakeholders push back against funding formulas they see as biased toward denser areas. Urban and suburban leaders, meanwhile, point to their own infrastructure challenges and argue that broadband equity cannot mean urban communities get nothing.

The structural tension is real. Every dollar allocated to one community is not available for another. The BEAD Program attempted to address this by prioritizing unserved areas, but that prioritization itself becomes a point of contention. Some rural towns feel they have waited long enough. Some suburban communities wonder why their aging infrastructure does not count as urgent.

What everyone agrees on is this: the gaps exist. An estimated three billion dollars in economic activity over the next decade hinges on closing them. Research from 2025 by the Benton Institute for Broadband and Society found that every dollar invested in rural broadband infrastructure generates approximately three dollars and twenty cents in regional economic activity over a ten-year period. That is not abstract benefit. That is jobs, business development, agricultural innovation, and education access.

The Fabric Challenge Process: Your Community Has a Voice in the Data

Before any broadband money reaches your town, the government needs to know where the gaps actually are. This is where the process gets both more democratic and more complicated than it sounds. The FCC’s broadband coverage maps, which determine which areas qualify for BEAD funding, are based on data submitted by internet service providers themselves. If those maps are wrong, your community might miss eligibility for funding it desperately needs.

The NTIA created a formal process called fabric challenges. If you believe the coverage maps inaccurately show broadband availability in your area, you can submit evidence and challenge the map. During the 2024 mapping cycle, communities across the country submitted challenges that corrected over two million eight hundred thousand location errors. That number is staggering. It means the maps, as initially filed, were substantially wrong in millions of places.

This is where civic engagement becomes technical work. Community groups have partnered with broadband advocacy organizations to conduct actual speed tests, document dead zones, and prove that the maps lie about their neighborhoods. It is unglamorous work. It involves spreadsheets and wifi testing apps and carefully documented coordinates. But it works. Your town might already have inaccurate broadband data filed with the FCC. The fabric challenge process gives you a mechanism to correct it before funding deadlines close.

The disagreement here is between different kinds of expertise. The FCC relies on provider data because providers have comprehensive records. But providers also have incentives to overstate coverage in some cases and understate it in others. Community-based data is messier, less comprehensive, but often more accurate on the ground. Getting both to align requires communities to participate actively, test their own networks, and push back when the official maps do not match their lived experience.

State Plans, Local Strategy: What Your Town Actually Needs to Do

The flowchart looks roughly like this. Your state submitted a BEAD implementation plan to the NTIA. That plan outlined how the state intends to allocate funding, which areas get priority, what the application process looks like for providers wanting to build infrastructure. Some states are treating this as primarily a state-level program, allocating funds through competitive processes. Others are devolving decision-making to local governments or regional entities. This variation matters enormously for how your community participates.

If your state has already received BEAD plan approval, the next step depends on your state’s specific approach. Check your state’s broadband office, usually housed in economic development or telecommunications agencies. That office should have published guidance on how local communities and private providers can apply for funding. If your state is still developing its plan, your window for community input might still be open. Attend town halls. Submit comments. Make it clear that your community has unmet broadband needs and is ready to partner on solutions.

Local governments can also challenge the accuracy of coverage maps before state plans are finalized. This is one of the most direct levers communities have. If your town can demonstrate that the FCC coverage map incorrectly shows your area as served, you increase the likelihood that state planners will prioritize your community for BEAD funding. Check the FCC Broadband Data Collection Map for your specific address. Document any inaccuracies. File a challenge through the formal process.

For broader guidance on where your state stands in the BEAD process, the NTIA BEAD Program State Tracker maintains current information on state plan approval status and implementation timelines. That is the authoritative source for where your state lands in the process.

The Disagreement Nobody Is Quite Naming Yet

Here is the structural conflict hiding beneath the surface of most BEAD discussions, and it is worth naming plainly. The question is not whether broadband equity matters. The question is whether the BEAD Program, as currently structured and funded, is sufficient to solve the problem fairly across all geographies and community types.

Rural broadband advocates argue that current funding levels still leave massive infrastructure gaps. Fiber to the last mile in genuinely remote areas remains expensive, and BEAD funding might cover eighty percent of actual costs, leaving communities or providers to find the remaining twenty percent. Some communities lack the local resources to fill that gap. In those cases, broadband equity means nothing.

Meanwhile, suburban and some urban communities argue that aging infrastructure, increasing demand, and fiber network expansion in their areas also constitute broadband equity issues. A community where broadband exists but is expensive, slow, or provided by a single monopoly provider faces real constraints too. The disagreement reflects genuine resource limitations and legitimate competing priorities, not just political posturing.

The most productive response is not to pretend the disagreement does not exist. It is to ensure that your community has the best possible data, makes its case clearly, and participates actively in the process. The money is real. The deadline is real. But so is the competition for it.

What Happened to Our Library This Year

I sat in the district office last month with three printed policy documents spread across a laminate table, a coffee getting cold beside them. The board had voted in March on what they called “curriculum alignment standards,” and I wanted to know exactly what that meant. Not what anyone said it meant at the heated public comment period. Not what the Facebook arguments had spiraled into. What the actual documents said.

The School Board Curriculum Fights of 2025 Came for Our District — Here's What the Actual Policy Documents Say
The School Board Curriculum Fights of 2025 Came for Our District — Here’s What the Actual Policy Documents Say

Three titles were removed from our middle school library that week. Two more from the high school. The district called it “resource optimization.” I called the librarian, who called it something else entirely, though she was careful to say it only after checking that the door was closed.

This isn’t about whether those specific books should have stayed or gone. This is about what we stopped having access to when we let those conversations happen in the abstract. This is about the concrete loss of something specific we had built, slowly, over years.

Illustration for The School Board Curriculum Fights of 2025 Came for Our District — Here's What the Actual Policy Documents Say
Illustration for The School Board Curriculum Fights of 2025 Came for Our District — Here’s What the Actual Policy Documents Say

The Numbers Tell a Story That Feels Abstract Until It Doesn’t

The PEN America Education Censorship Index documented nearly 10,000 instances of book challenges across 36 states during the 2023-2024 school year alone. That’s a 28 percent jump from the year before. We’re not at a plateau. The momentum kept building straight into the 2025-2026 school year. This isn’t a local thing. This is what’s happening to libraries and classrooms in nearly every state, including ours.

What made this real for me wasn’t the statistic. It was learning that our district’s removal decisions happened without our librarian having a structured appeal process documented anywhere. She could object, she was told, but there was no written procedure for how that objection would be evaluated. That matters more than you’d think. A procedure is democratic. An absence of procedure is just whatever happens.

Across the country, 47 state legislatures have introduced or passed some form of legislation about curriculum transparency or parental rights in education since 2021. The word “transparency” appeared in almost every board meeting agenda I attended this year. Everyone wanted to be transparent. Nobody seemed to want to define what that word actually obligated them to do.

The Documents Say One Thing, But the Infrastructure Says Another

I asked for our district’s full curriculum documents. The ones that would tell me what exactly was being taught, what books were assigned, what the frameworks actually were. The administrator I asked looked confused, then sympathetic, then explained they weren’t really formatted for public access. They existed, she said. They were just sort of scattered across different platforms and building-level drives. She could get me some of it eventually, if I submitted a formal request.

Here’s what a curriculum quality review by the Thomas B. Fordham Institute found in 2025: fewer than 30 percent of school districts in this country have their curriculum documents posted anywhere that a parent could actually find them within a single click from the district homepage. We talk constantly about transparency and parent involvement and educational choice, but most families don’t have access to the actual documents that would let them make informed decisions. It’s not that the information is secret. It’s that it’s inaccessible, which does the same work.

Our district falls into that 70 percent. We have excellent parent volunteers. We have teachers who care deeply. But there’s no system where a parent sitting at home could actually pull up our curriculum in a format they could read and search and share. That’s not about good intentions. That’s about infrastructure, which is unsexy and easy to defer.

What We Actually Lost When the Removals Started

The research from RAND Corporation K-12 Education Research on districts that removed curriculum related to diversity and inclusion found something interesting: standardized test scores didn’t improve. Not even a little. But teacher retention dropped by 11 percent on average. The teachers who had designed lessons, integrated materials, built relationships around diverse perspectives were more likely to leave.

Our two most experienced English teachers left over the summer. Both of them had been here twelve years. When I asked why, they were tactful, but the timing was clear. They had built units around books that were no longer on the approved list. They had collaborated with colleagues on projects that suddenly didn’t fit the parameters. They looked ahead and saw a narrower curriculum, and they decided to look for work elsewhere.

Last month, I learned that teachers across the country are now spending an average of 612 dollars of their own money annually to replace or supplement materials removed from approved curriculum lists. That’s not a metaphor. That’s teachers buying books themselves because they believe their students need them. That’s an indictment of something. I’m not entirely sure what yet, but it’s real and it’s quantified and it matters.

What Happens When You Actually Read the Fine Print

The policy documents in front of me on that table had been written carefully. They used phrases like “age-appropriate alignment” and “community values reflection” and “educational best practices.” Nowhere did it say “we are going to make decisions about what students can read.” It just happened as a logical consequence of the language. That’s not an accident. That’s how this works.

When you read the actual minutes, the decisions were never presented as removals. They were presented as “reallocation of resources” or “curriculum refinement” or “parental feedback integration.” Only when you cross-reference three different meetings and four different documents do you realize what the cumulative effect was. A student who graduated two years ago had different access to literature than a student entering high school now. That’s the difference between what was written and what actually happened.

The point of telling you this is not to convince you that I’m right about what should or shouldn’t be in schools. The point is that these decisions happened in a way that made it hard to actually see them happening. They’re embedded in policy language that sounds neutral. They appear as consequences of something else. You have to actually read the documents. You have to cross-check them. You have to ask follow-up questions to people who would rather you didn’t.

That’s the real thing we need to talk about. Not whether books should be removed or kept. Whether the processes for making those decisions are transparent enough that ordinary people can participate in them. Whether teachers have clarity about what they can teach. Whether families actually understand what their kids are learning. Whether there’s an actual procedure for someone who thinks a decision was wrong.

I’m still working through these documents. The coffee’s long cold, but the table’s still full of papers. If you want to look at your own district’s curriculum documents, I’d be happy to compare notes over coffee on a Saturday. Better yet, I’d like to help figure out how we actually make these things accessible. That part seems like work worth doing together.

What We’re Actually Arguing About

If you’ve been to a city council meeting in the past year, you’ve probably heard someone mention the 15-minute city. Maybe they said it with hope. Maybe they said it like a warning. The concept sounds simple enough: neighborhoods redesigned so that most daily needs are within a 15-minute walk or bike ride. Groceries, schools, healthcare, work, community space. All close. All accessible without a car.

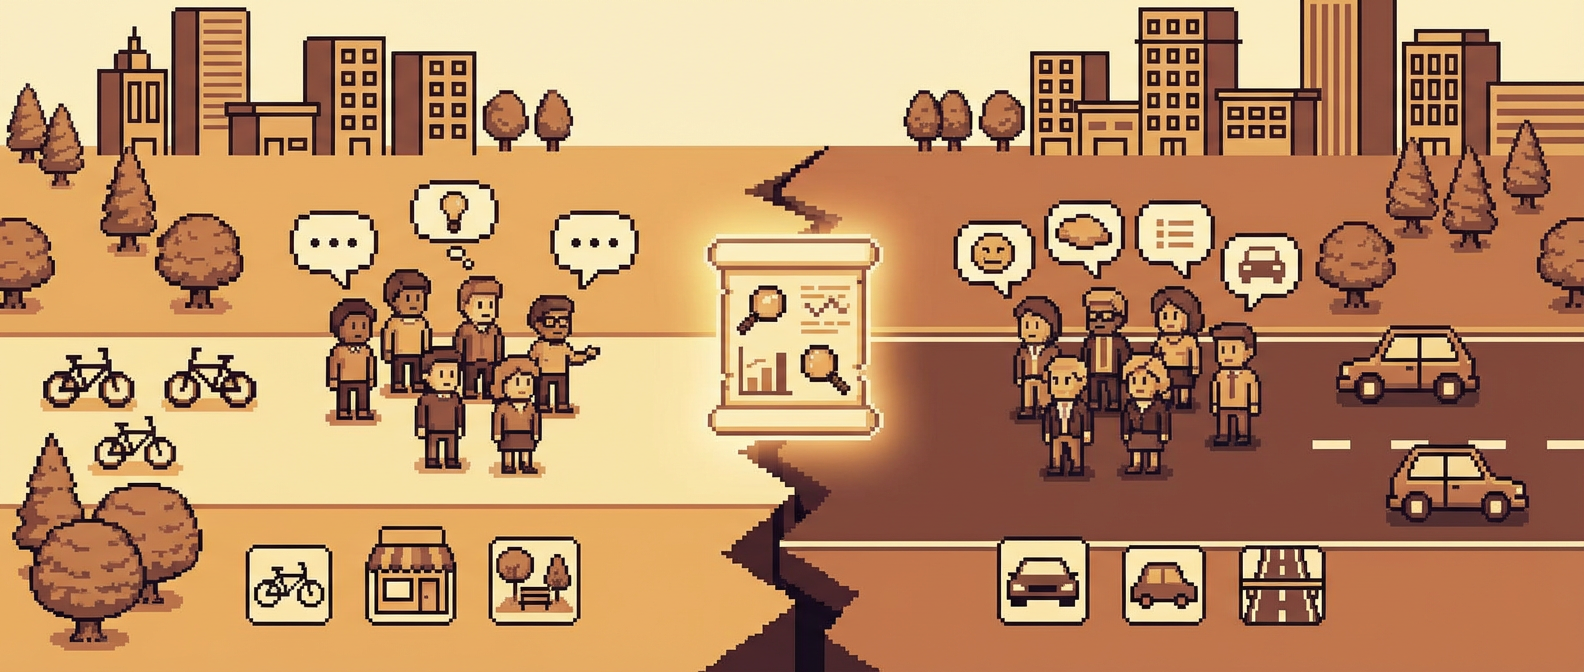
The 15-Minute City Debate Is Tearing Local Communities Apart — Here's What the Research Actually Shows
The 15-Minute City Debate Is Tearing Local Communities Apart — Here’s What the Research Actually Shows

But somewhere between that simple idea and what’s happening in real neighborhoods, we’ve lost the thread. The 15-minute city has become a proxy war. Urban planners and sustainability advocates talk about walkability and local economies. Residents in other communities are organizing against what they see as top-down urban redesign. Caught in the middle are the actual people living in these neighborhoods, trying to figure out what’s real and what’s rhetorical.

Here’s what’s making this debate so bitter: it’s not really about a concept anymore. It’s about trust. It’s about whether your city government is listening to you or designing your life without you. It’s about whether change is happening to you or with you.

Illustration for The 15-Minute City Debate Is Tearing Local Communities Apart — Here's What the Research Actually Shows
Illustration for The 15-Minute City Debate Is Tearing Local Communities Apart — Here’s What the Research Actually Shows

The Numbers Tell a Quieter Story Than the Shouting

Let’s start with what’s actually happening on the ground. At least 12 U.S. cities including Detroit, Austin, and Denver have formally adopted or are piloting 15-minute city zoning frameworks, following the well-documented model that Paris implemented. These aren’t hypothetical anymore. They’re real zoning changes affecting real neighborhoods right now.

When researchers from MIT’s Urban Mobility Lab studied neighborhoods that were redesigned under these principles, they found something interesting: residents reported taking 22% fewer car trips per week. That’s not a small change. That’s the difference between commuting alone and walking to get a coffee. But here’s the part that matters more for your community: local business revenue increased by 19%. More foot traffic. More neighbors seeing neighbors. More small business survival.

Portland, Oregon has been at this longer than most cities. Their 20-Minute Neighborhood initiative, detailed in their Portland Bureau of Planning 20-Minute Neighborhood Initiative, reduced average resident commute times by 8 minutes per day. Eight minutes doesn’t sound radical until you do the math: that’s over 60 hours per year that people aren’t sitting in traffic. That’s time with their families. That’s time volunteering. That’s time for life to actually happen.

The Congress for the New Urbanism 2025 Annual Report shows that mixed-use zoning applications increased by 28% nationally compared to just two years ago. Developers are betting money on this model. Cities are rewriting their rule books. This is happening.

Why So Many People Believe It’s a Conspiracy

A YouGov poll from October 2025 found that 41% of Americans had heard of the 15-minute city concept. That’s actually remarkable penetration for an urban planning term. What’s less remarkable, and more troubling, is that 38% of those people associated it primarily with conspiracy theories rather than actual urban planning policy.

Stop and think about that for a moment. More people think 15-minute cities are a plot than think they’re a planning tool. That’s not a failure of the concept. That’s a failure of communication. A failure of trust.

The conspiracy theories aren’t random. They tap into something real: the experience of having neighborhood change imposed on you. When zoning happens without community input, when small businesses get displaced by development, when rents rise faster than wages, when the corner store your grandmother used suddenly turns into luxury condos, that’s not a conspiracy. That’s what actually happened. The theories attach themselves to 15-minute cities because the emotional truth is there, even if the factual basis isn’t.

This is what we’ve lost: the confidence that our neighborhoods are ours. That we have a voice in what happens here. That change isn’t something done to us.

The Real Question Isn’t About Walkability

Here’s what the research can’t show you: whether your city actually listened to you before deciding your neighborhood was getting redesigned. Numbers don’t capture the feeling of walking into a council meeting and realizing the plan has already been decided. Data doesn’t explain why a barber who’s been on your block for 15 years suddenly can’t afford the rent because the building was sold to developers banking on the neighborhood’s new walkability index.

The best 15-minute city implementations have one thing in common: they involved their neighborhoods early and often. They asked people what they actually needed within walking distance. They created protections for existing small businesses. They had conversations, not announcements. In places where this happened, the opposition softened. People understood that change was coming anyway, but at least they had a role in shaping it.

The worst implementations did what cities have always done: decided what was best and expected people to accept it. Then they were shocked when people started showing up to council meetings angry.

What Happens Now, and What You Can Actually Do

If you care about your neighborhood, the path forward is boring and specific and completely within your reach. Go to the next city planning meeting. Read the zoning documents. Find out if your city is considering any kind of mixed-use zoning changes. Ask questions. Not angry questions. Specific ones. What protections exist for current residents? Who decided this was a priority? How will small business owners be supported through any transition?

The data suggests that 15-minute city principles work better than car-dependent sprawl. It’s not a conspiracy. It’s not magic. It’s just that when things you need are close, life is less exhausting and communities are stronger. But that’s only true if the people living there chose it, or at least had a genuine voice in shaping it.

The debate tearing communities apart right now is really a debate about power. Who decides what your neighborhood becomes? You can let that decision happen in a room without you, or you can show up. One takes no time. The other takes coffee and stubbornness and actually reading the agenda. The research is clear about what works. The question is whether we’ll get there with people, or do it to people. That part is entirely up to us.

The Budget Moment We’re Actually In Right Now

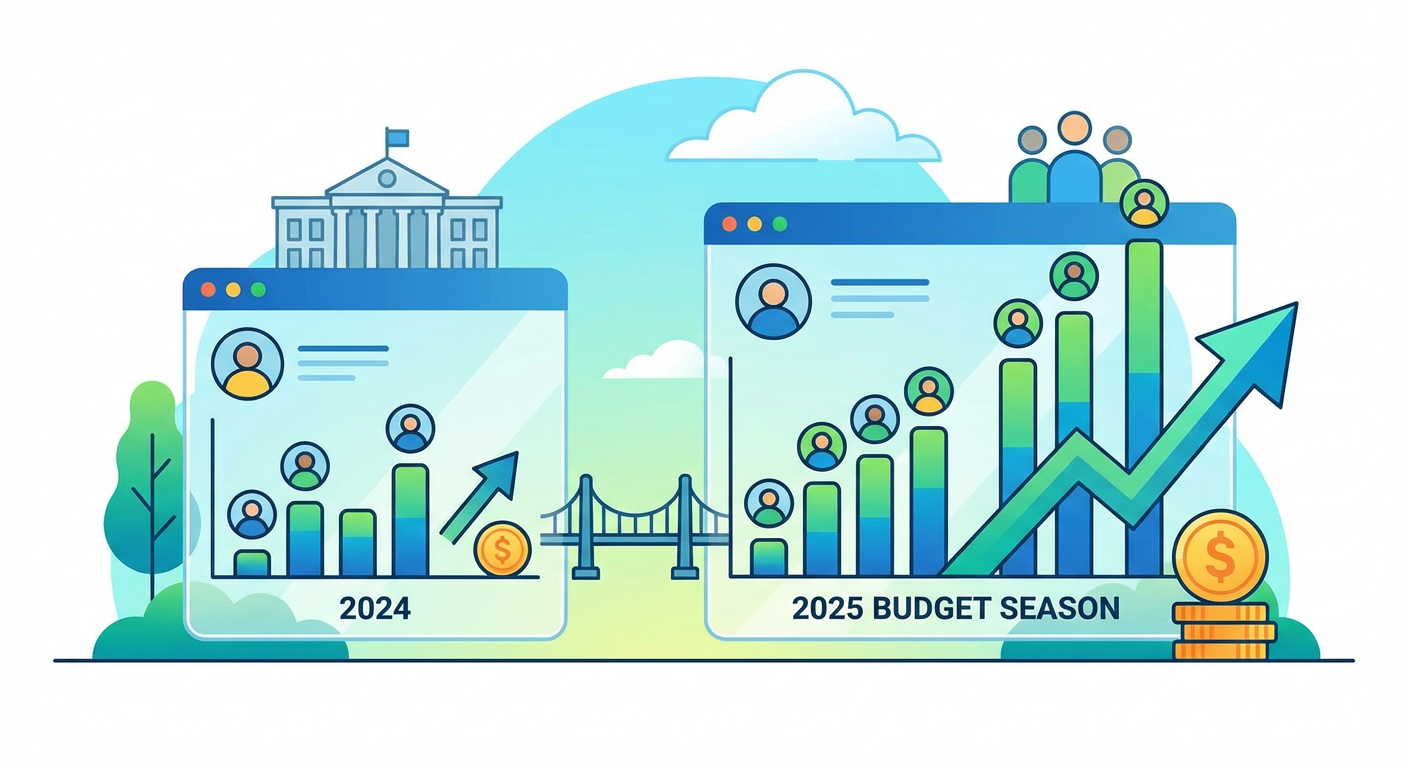
Your city council just finished or is finishing voting on next year’s budget. Thousands of lines of text have been debated, revised, combined, and approved in public meetings that roughly seven out of every hundred residents in your town probably attended. The other ninety-three of you are about to live under spending decisions you didn’t know were being made. This isn’t a criticism. It’s a structural reality. But it’s also a fixable one, and right now in early 2025 is the exact moment to understand what actually happened and what it means for where you live.

What Your City Council's 2025 Budget Actually Says About Your Neighborhood (Breaking Down the Line Items Nobody Reads)
What Your City Council’s 2025 Budget Actually Says About Your Neighborhood (Breaking Down the Line Items Nobody Reads)

Here’s what makes this particular budget season different from most: your city is almost certainly dealing with a specific pot of federal money that’s running out. The infrastructure funding that passed Congress back in 2021 is making its final major disbursement to local governments right now. That’s roughly 550 billion dollars that cities have been gradually receiving over the past few years, and the last tranche is hitting local accounts in 2025. Your council members have been in a room somewhere deciding how to spend it. Those decisions explain a lot of what you’re about to see happening on your streets.

Illustration for What Your City Council's 2025 Budget Actually Says About Your Neighborhood (Breaking Down the Line Items Nobody Reads)
Illustration for What Your City Council’s 2025 Budget Actually Says About Your Neighborhood (Breaking Down the Line Items Nobody Reads)

Follow the Infrastructure Money First

Most cities across the country are doing something similar right now: they’re increasing what they spend on infrastructure. According to the National League of Cities 2025 State of the Cities Report, roughly two-thirds of municipalities increased infrastructure spending compared to their 2024 budgets. The average bump was twelve percent. That’s a lot. But infrastructure is a broad category. It can mean repaving streets, replacing water mains, fixing bridges, upgrading internet access, or hardening power systems against storms. The real question is which category your city chose.

Pull up your city’s actual budget document. Yes, the long PDF. Search for capital projects or infrastructure line items. You’ll see either specific projects listed or broader categories like “street maintenance” or “water systems.” This is where the federal money is going. Some cities are betting on fixing things that are already broken. Others are betting on prevention. Some are focused on visible infrastructure like roads. Others are making less obvious choices like upgrading stormwater systems or replacing lead pipes in older neighborhoods. None of these choices are wrong, exactly. They’re just different bets about what matters most.

The Public Safety Conversation That’s Actually Happening

In forty-three of the fifty largest cities in the country, public safety budgets went up by at least five percent this year. That’s not a secret. It’s in every municipal budget that got voted on. But the conversation around that increase is fractured in ways that budget documents don’t really capture. Some neighborhoods wanted more police presence and faster response times. Other neighborhoods wanted different kinds of support: mental health crisis workers, housing programs, community coordinators. Both groups asked their city council to allocate more money. Councils in many cities tried to do both. Sometimes that meant the total safety budget increased even as police department allocations held steady or slightly decreased, because money went to alternative response programs too. Sometimes it meant police funding increased outright.

The thing about budget numbers is that they can be accurate and misleading at the same time. A five percent increase in public safety spending sounds concrete, but it tells you almost nothing about whether that money is going toward more patrol cars, body cameras, community programs, mental health support, or hiring freezes in other departments to fund overtime. You have to read deeper. Look at what specific programs got added or expanded. Look at what got cut to make room. The budget is the actual conversation your city had, but you have to learn to read it like a language.

What Most People Miss: The Things That Didn’t Get Funded

City budgets are defined as much by what’s missing as by what’s in them. A neighborhood that wanted a new community center but got street lighting upgrades instead is technically getting investment. Technically accurate, not entirely satisfying. Parks departments routinely ask for more than they get. Mental health services request expansions that get partially funded. Housing programs hope for resources that materialize at half the requested amount. These aren’t failures. They’re just the reality of finite resources and competing priorities.

This is where conflict actually lives in municipal budgeting, and it’s worth understanding clearly. It’s rarely a battle between good and evil. It’s usually a disagreement between legitimate needs. A neighborhood association wants more tree planting in their area. The parks department wants to maintain existing trees at a level that actually keeps them alive, which is expensive and unglamorous. Both are right. A school district wants more funding. The transportation department needs to replace aging infrastructure before it fails. Both are right. A community group wants new affordable housing programs. A fire department is understaffed and needs to hire. Both are right. The budget is where these rights collide against the ceiling of available money.

How to Actually Read Your Budget Without Losing Your Mind

Start small. Don’t try to understand the whole thing at once. Pick one area that matters to you. Parks? Transportation? Housing? Schools? Once you pick a category, search for it in your municipal budget document. Look at this year’s allocation compared to last year’s. That tells you whether things are growing or shrinking. Then look at the narrative sections, usually near the beginning of budget documents. Cities write explanations of their choices. These explanations are where the actual reasoning lives. They’re often written in bureaucratic language, but they’re also surprisingly honest about tradeoffs.

Less than eight percent of residents in smaller cities actually attend or read budget hearings. It’s not because people don’t care. It’s because the materials are genuinely difficult to navigate and the process feels designed for specialists. But that’s changing. A civic transparency platform that handles over fifteen hundred municipalities saw a thirty-four percent increase in resident dashboard logins during this budget season compared to last year. People are trying. More resources exist now to help you understand what your city is actually spending money on. The Government Finance Officers Association Budget Resources offers plain-language guides. Many cities now publish simplified budget summaries alongside the full documents. Some have interactive tools that let you see spending by category or neighborhood. The barrier is lower than it used to be.

What This Actually Means for Your Neighborhood

Your streets are about to change in specific ways determined by decisions made in the last few months. Some of those changes will be visible immediately. Others will take years. Some will satisfy you. Others will frustrate you. Almost all of them are the result of real choices made by people trying to balance genuine competing needs with limited resources. Understanding what your city council actually budgeted for is the first step toward either supporting what they did or advocating effectively for something different next time around.

The next budget cycle starts in a few months in most cities. That’s when you can show up. That’s when you can be one of the eight percent who actually reads the minutes and understands the line items, and advocates for your neighborhood’s priorities rather than just reacting to what happened. But you can’t do that effectively until you understand what happened this time. So read your budget. Find the section that matters to you. See what your city actually chose to invest in. Then come back and tell us what you found. We can figure out what it means together.

The Money Is Actually There (And It’s Waiting)

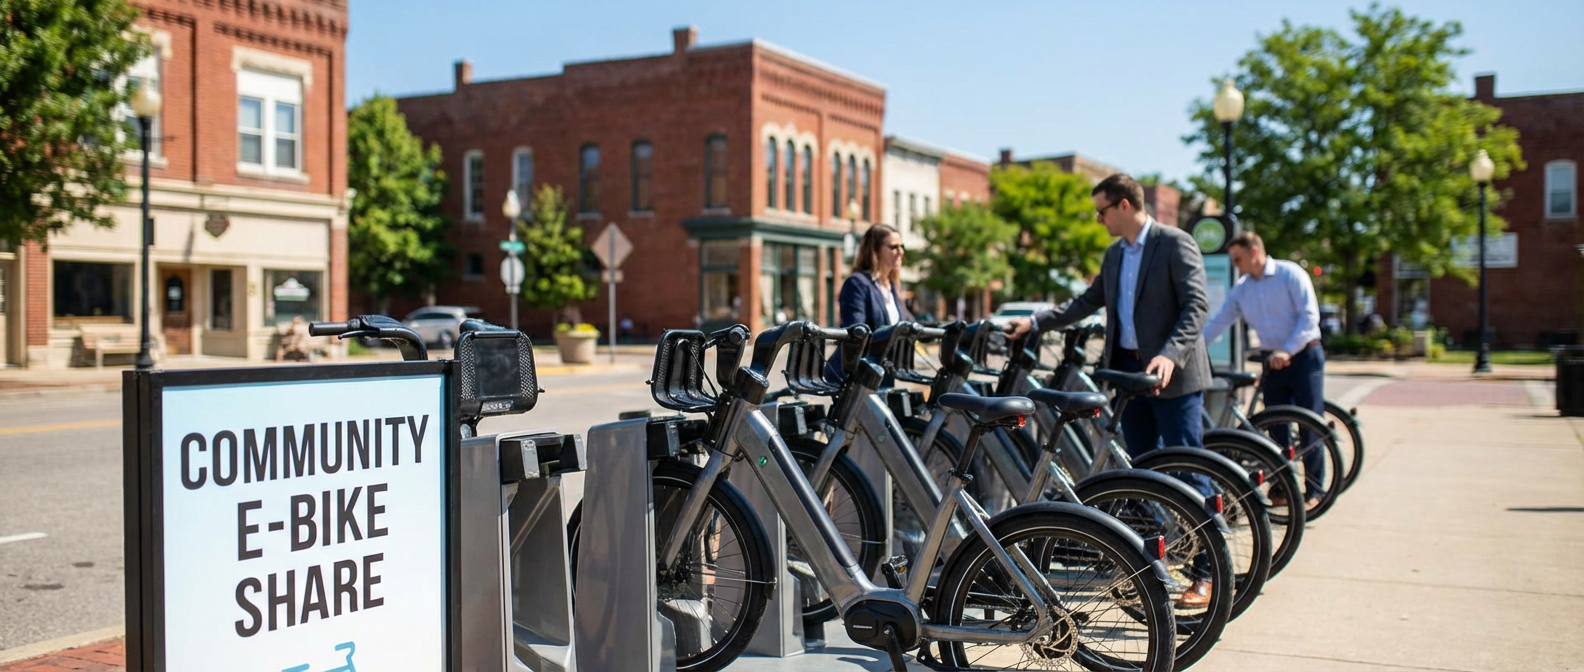
Here is something that happened while you were probably not reading city council agendas: the federal government decided to spend 450 million dollars on getting people onto electric bikes. Not as part of some flashy national campaign. Not with press conferences or celebrity endorsements. Just quietly, systematically, through the U.S. Department of Transportation’s Active Transportation Infrastructure Investment Program, which funded over 60 municipal e-bike lending and subsidy programs in communities with fewer than 100,000 residents. This is the kind of funding that transforms how a town moves, if someone actually pays attention and puts in the work to apply.

The E-Bike Library Quietly Coming to Your Town: How Your City Can Transform Commutes Without Breaking the Bank

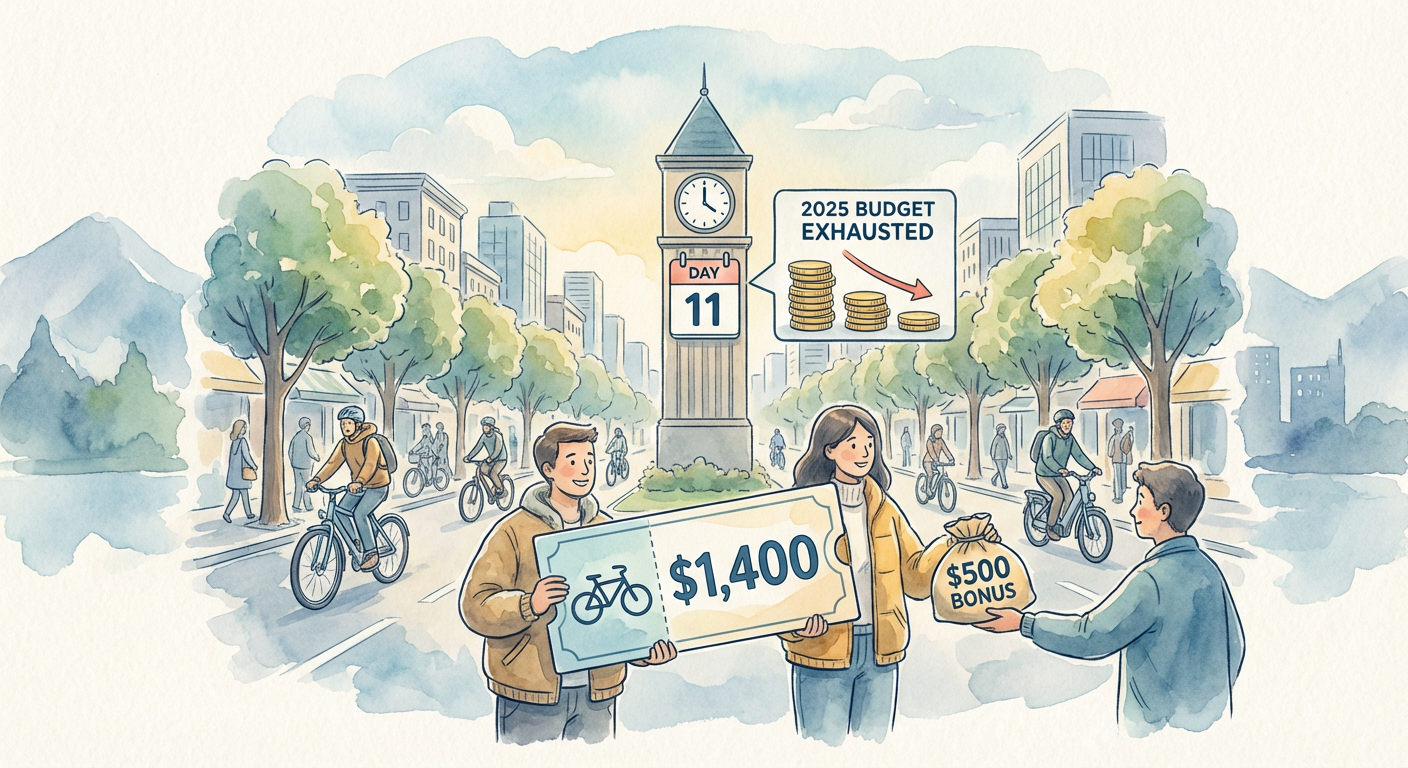
The speed at which this money disappears tells you something important about demand. Denver’s e-bike rebate program, which offered up to 1,400 dollars per bike with an additional 500 dollar bonus for lower-income applicants, exhausted its entire 4 million dollar 2025 budget allocation in eleven days. Eleven days. Not because Denver is some bicycle utopia. Because people wanted to ride bikes. They just needed help affording them. The program didn’t run out because the city was throwing money at a problem nobody cared about. It ran out because the problem was real and the solution actually worked.

Illustration for The E-Bike Library Quietly Coming to Your Town: How Your City Can Transform Commutes Without Breaking the Bank

What Happens When Your Neighbor Gets an E-Bike

This is the part that matters most, and it is measurable. A 2025 study from the University of Colorado Denver tracked what actually happened to people who participated in e-bike programs. Thirty-eight percent of participants reduced their car trips by more than four trips per week. That is not a rounding error. That is someone who used to drive to the grocery store, the gym, the coffee shop, their friend’s house. Now they ride. The infrastructure did not change. The roads are the same. What changed is that the barrier to entry fell away.

The data gets more specific when you look at who benefited most. Lower-income participants showed the highest rates of modal shift, meaning the people who got the most out of the program were people for whom a 1,400 dollar bike represented an actual barrier to getting around. This matters because it means e-bike programs are not solving a problem for the wealthy who could have bought a bike anyway. They are solving it for people whose transportation options were genuinely limited before. That is the definition of infrastructure that works.

How a Library System Became a Bike System

Chattanooga, Tennessee took a different approach entirely. Instead of rebates, the city launched a free municipal e-bike library in March 2025. You check out an e-bike like you check out a book. You need a library card. You reserve online or in person. You ride for a few hours or a few days. You return it. Fourteen neighborhood hubs across the city mean that no matter where you live, there is a place to access a bike. In the first six months, the program recorded 12,000 individual checkouts. That is not 12,000 bikes. That is 12,000 separate trips, which means people figured out that this was worth their time to do again.

The genius of the library model is that it removes multiple barriers at once. You do not have to own a bike. You do not have to maintain it. You do not have to figure out where to store it. You do not have to come up with 1,400 dollars. You just need to know where your nearest hub is, which most people in Chattanooga apparently do. The program works because it meets people where they are instead of asking people to upend their entire life to ride a bike.

The Safety Effect Nobody Expected

Here is something else that happened as municipal e-bike programs expanded: cycling got safer. The League of American Bicyclists State Report Cards tracked cycling-related injury rates in states with active municipal e-bike incentive programs and found an average eleven percent year-over-year decline. This might seem counterintuitive. More bikes on the road. More accidents, right? But that is not what happened. What happened is that e-bikes brought a different kind of rider into the bike lane. People who would never have cycled before now had a tool that made it possible. These riders tend to be slower, more cautious, older, and more visible. They changed the composition of who rides. And somehow, everyone got safer.

The stability of e-bikes matters too. A heavier bike with better weight distribution and lower center of gravity handles differently than a lightweight road bike. Someone riding an e-bike is less likely to wobble into traffic. Less likely to lose control on hills. Less likely to run a stop sign because they need momentum to make it. The infrastructure did not change. The riders did. The streets became safer because the people on them were riding differently.

What This Means for Your Town

So where does this leave you, sitting in your actual town with your actual commute and your actual questions about whether any of this matters. It means that the U.S. DOT Active Transportation Infrastructure Investment Program is still actively accepting applications. It means someone on your city council, or someone who could talk to your city council, could move forward with a rebate program or a lending library or some hybrid nobody has thought of yet. It means there is federal money waiting for municipalities that are willing to do the work of applying.

It also means this is not about whether you are a bicycle person. This is about whether you want to live in a place where transportation options exist. Where a single parent can get to work without sitting in traffic. Where a teenager can get to school without depending on someone else’s schedule. Where an older person can get to the doctor without driving. These are not bicycle problems. These are human problems. The e-bike happens to be the tool that solves them.

The next city council meeting is probably this month. The agenda is probably online. Someone probably needs to raise their hand and ask whether your town has applied for this funding. If you know anything about how your town moves, or how it fails to move, or who gets left behind because movement is too expensive or too difficult, then this conversation matters. The money is real. The results are documented. The question is just whether anyone is paying attention enough to say yes.